
XAUUSD carving out a head and shoulders pattern – Gold, despite the recent bullish momentum, is carving out a bearish head and shoulders pattern with the neckline resistance at 1208 – 1210. A break below this level could extend declines towards 1100. On the lower time frame, while EURUSD broke out from the rising wedge pattern, gold continues to consolidate within the rising wedge, but a potential break down looks imminent.
EURUSD Daily Analysis
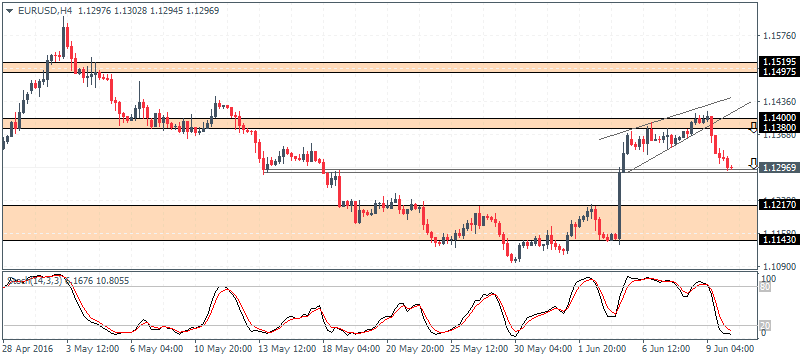
EURUSD (1.129): EURUSD broke out to the downside on the inside bar formed earlier this week, albeit a brief push to the upside. But a follow through is required for prices to close bearish today, especially with the 50 day EMA looming as support near 1.1268. A close below this level could signal further downside to 1.120. On the 4-hour chart the declines have been validated by the rising wedge pattern but minor support at 1.1286 – 1.1292 will likely see a short term bounce. Failure to hold out as support could extend EURUSD declines to 1.12170. To the upside, watch for a retracement back to 1.1368 – 1.1380 region.
USDJPY Daily Analysis
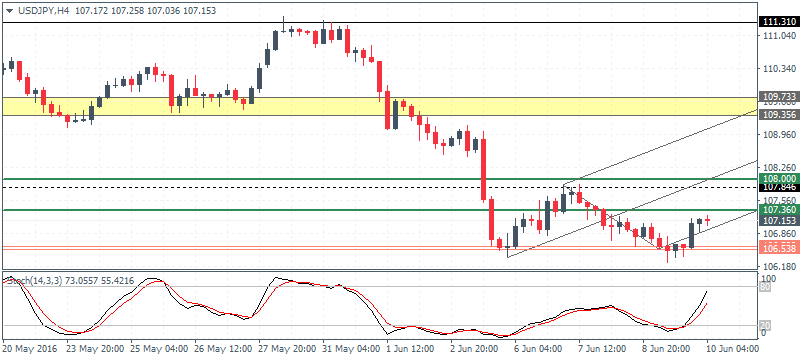
USDJPY (107.1): USDJPY saw a rejection near the lows of 106.53 and closed in a modestly bullish note. Further upside is however needed to confirm the move to the upside, especially with resistance at 108 – 107.95 looming overhead. Clearing this resistance could signal further upside with 110.0 resistance level coming into focus. Alternately, a bearish close below the 106.5 lows could signal further downside to 105.210 support.
GBPUSD Daily Analysis
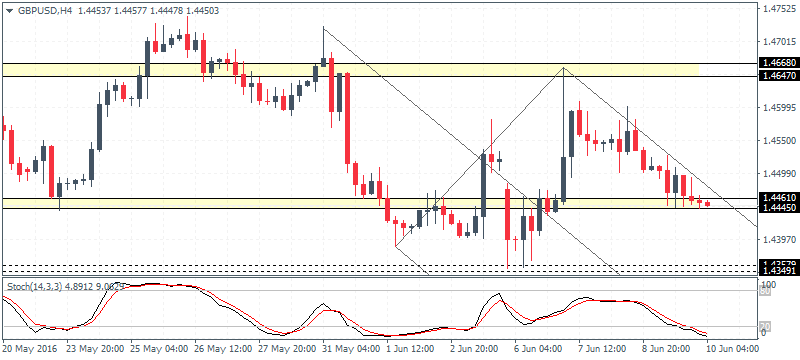
GBPUSD (1.445): GBPUSD has been falling for two consecutive days and price action is likely to head back to Monday’s close above the support at 1.4425. A break below this support could extend GBPUSD declines towards 1.4358 – 1.4350 lower support level. However, watch for a possible breakout of the falling median line on the 4-hour chart which could signal a possible rally back to the upper resistance at 1.4647 – 1.4660.
Gold Daily Analysis
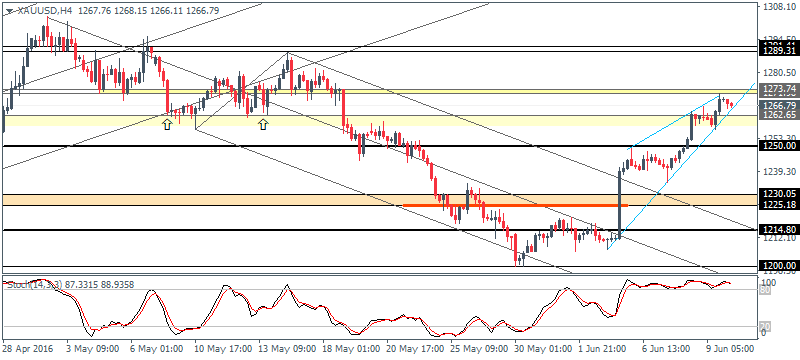
XAUUSD (1266): Gold prices extended their gains for the second day with price close above the 1264 handle. Further upside could still keep the bearish bias in gold with the next level to be challenged at 1290. To the downside, support at 1230 needs to clear for a decline lower. Also, note the possible head and shoulders pattern being formed on the daily chart in gold with the neckline support coming in at 1208 – 1210, which if breaks could signal a correction towards 1112 – 1098 levels. On the 4-hour chart, the rising wedge pattern remains in play and gold prices could start their declines. But there is a risk of prices pushing to 1271 – 1272 level of resistance. Support comes in at 1250 followed by 1230 – 1225.
Source: Orbex Forex Broker (Review and Forex Rebates Up 85%)
Categories :
Tags : 50 day EMA EUR/USD forex bonus without deposit Forex Broker forex broker bonus forex learn forex learning forex learning pdf forex tutorials for beginners pdf how to trade forex for beginners pdf learning forex trading pdf USDJPY Daily Analysis XAUUSD

