3D Trading – We search for a correction that is about to end. It makes sense because if we see a trend on a specific time frame than we are likely to be already too late to make an entry. Our objective is to enter the market at the end of a correction. Our prime target is the end of waves 2 or B.
We determine the most likely price zones for the end of the correction using our Square of 9, pattern, divergence & Elliott Wave analysis as well as price and time projection. When price reaches those projected zones, we go to shorter time frames. We look to see if the pattern appears complete. We once again use the same projection techniques that we previously used. We base our analysis on all of our available tools. After we see that the pattern on the short time frame appears to be complete then we look at our oscillators for an entry.
1) We look at the W%R and establish what time frames will signal our entry. We patiently wait for both signals.
2) We enter using the two halves technique meaning that the first half will be exited when we gain as many pips as we risked (usually). At the time of our first half’s exit we might move the stop loss of the second half. We will exit the second half based on the higher time frame’s W%R.
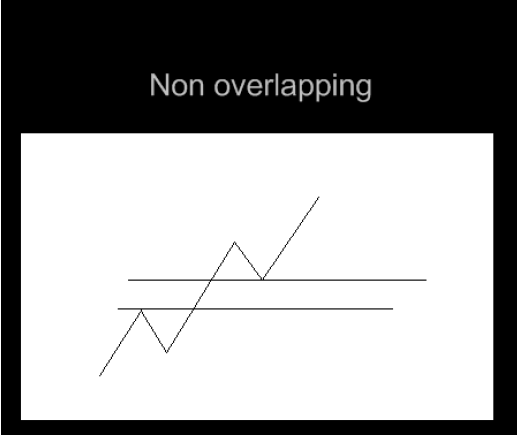
What is a trend?
– A trend usually unfolds in a 5 non-overlapping wave pattern.
– A trend usually goes in the same direction of the higher degree trend.
What is a correction?
– A correction usually unfolds in an overlapping pattern and goes in the opposite direction of the higher degree trend.
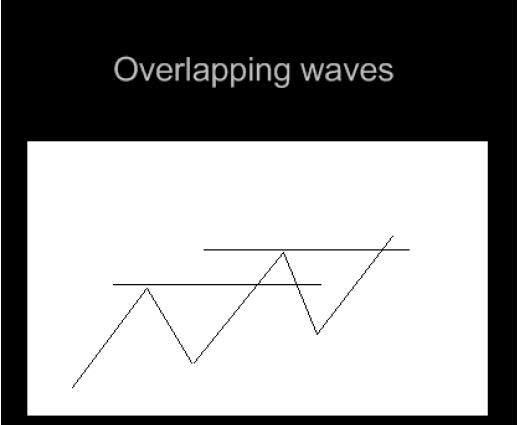
When the market overlaps it is usually a clear signal that a correction is taking place. An overlap is when price makes a low or a high, and then reverses and penetrates that price range of the last wave. When the market overlaps, more
often than not it is making a correction.
Elliott Wave – the Basic Pattern
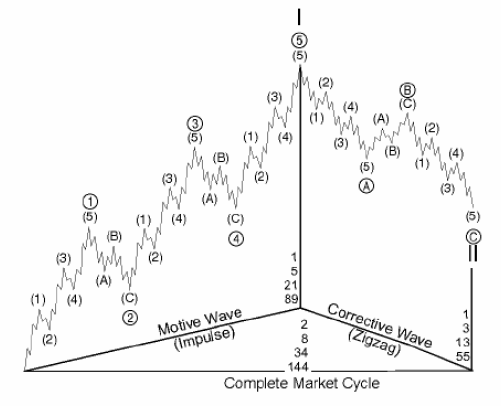
Elliott’s pattern consists of “impulsive waves” and “corrective waves.” An impulsive wave is composed of five subwaves. It moves in the same direction as the trend of the next larger size; a corrective wave is divided into three subwaves. It moves against the trend of the next larger size.
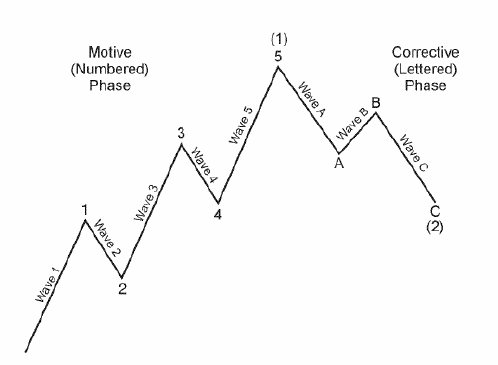
Each wave is further divided into that very same pattern, like so:
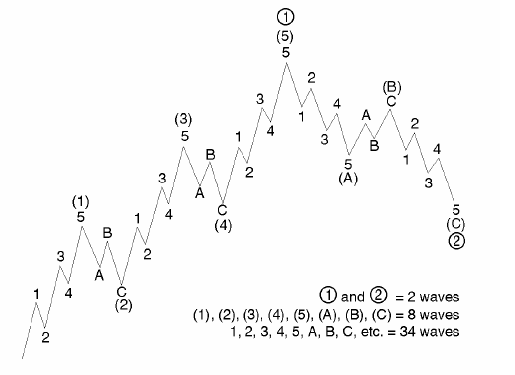
In the above illustration, waves 1, 2, 3, 4 and 5 together complete a larger impulsive sequence, labeled wave (1). The impulsive structure of wave (1) tells us that the movement at the next larger degree of trend is also upward. It also warns us to expect a three-wave correction — in this case, a downtrend.That correction, wave (2), is followed by waves (3), (4) and (5) to complete an impulsive sequence of the next larger degree, labeled as wave 1. At that point,
again, a three-wave correction of the same degree occurs, labeled as wave 2.Note that regardless of the size of the wave, each wave one peak leads to the same result a wave two correction.
Within a corrective wave, subwaves A and C are usually smaller-degree impulsive waves. This means they too move in the same direction as the next larger trend.(In Figure 2 below, waves A and C are in the same direction as the larger wave (2).)Note that because they are impulsive, they themselves are made up of five subwaves. Waves labeled with a B, however, are corrective waves; they move in opposition to the trend of the next larger degree (in this case, they move upward against the downtrend). These corrective waves are themselves made up of three subwaves.
It is important to remember that Elliott Wave is not a method but more a theory and a great way to analyze the market.
The most common type of correction is a 3 wave correction.
– According to Elliott wave theory a 3 wave correction could be either a Zig-Zag or a flat correction; for simplicity I will refer to all 3 wave correction as an A-B-C correction.
– All other types of corrections will be referred to as complex corrections.
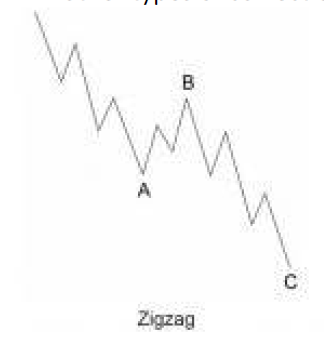
Zig Zag – made of 3 waves; A – B – C.
Wave A divides into 5 sub waves, wave B divides into 3 sub waves and wave C divides into 5 sub waves.
– Wave B is usually 38.2% or 50% of wave A.
– Wave C is usually 100% or 161.8% of wave A.
A-B-C Guidelines:
1. Wave C should go beyond the extreme of wave A.
2. We begin to assume that wave C is over, once price turns and goes back into the
range of wave A; at that point the bare minimum conditions for a correction are complete.
3. Once price surpasses the extreme of wave B, we assume that the correction is over.
To Read more,Please download the book.
Ruben Topaz
3D Trading, 3D Trading eBook, 3D Trading PDF, Download 3D Trading, Elliott Wave - the Basic Pattern, Elliott Wave analysis
Similar Videos and E-books


LEAVE A COMMENT
All Books
For Beginners
- Candlesticks For Support And Resistance
- Online Trading Courses
- Commodity Futures Trading for Beginners
- Hidden Divergence
- Peaks and Troughs
- Reverse Divergences And Momentum
- Strategy:10
- The NYSE Tick Index And Candlesticks
- Trend Determination
- The Original Turtle Trading Rules
- Introduction to Forex
- The Six Forces of Forex
- Study Book for Successful Foreign Exchange Dealing
- Forex. On-Line Manual for Successful Trading
- 18 Trading Champions Share Their Keys to Top Trading Profits
- The Way to Trade Forex
- The Truth About Fibonacci Trading
- Quick Guide to Forex Trading
- Chart Patterns and Technical Indicators
- Forex Trading
- Trading Forex: What Investors Need to Know
- My Dog Ate My Forex
- Point & Figure for Forex
Forex Market in General
- Screen Information, Trader Activity, and Bid-Ask Spreads in a Limit Order Market
- Strategic experimentation in a dealership market
- Limit Orders, Depth, and Volatility
- Reminiscences of a Stock Operator
- Market Profile Basics
- Quote Setting and Price Formation in an Order Driven Market
- Phantom of the Pits
- An Introduction to Market Profile and a Users Guide to Capital Flow Software
- The Effect of Tick Size on Volatility, Trader Behavior, and Market Quality
- Trading as a Business
- What Moves the Currency Market?
- Macroeconomic Implications of the Beliefs and Behavior of Foreign Exchange Traders
- All About the Foreign Exchange Market in the United States
Psychology of Trading
- A Course in Miracles
- Thoughts on Trading
- Calming The Mind So That Body Can Perform
- Lifestyles of the Rich and Pipped
- The Miracle of Discipline
- Zoom in on Personal Trading Behavior And Profit from It
- The Woodchuck and the Possum
- 25 Rules Of Forex Trading Discipline
- Stop Losses Are For Sissies
- Your Personality and Successful Trading
- Trading as a Business
- The 7 Deadly Sins of Forex (and How to Avoid Them)
- The 5 Steps to Becoming a Trader
Money Management
- Risk Control and Money Management
- Money Management
- Position-sizing Effects on Trader Performance: An experimental analysis
- Fine-Tuning Your Money Management System
- Money Management: Controlling Risk and Capturing Profits
- Money Management Strategies for Serious Traders
- The Truth About Money Management
- Money Management and Risk Management
Forex Strategy
- 1-2-3 System
- Bollinger Bandit Trading Strategy
- Value Area
- The Dynamic Breakout II Strategy
- Ghost Trader Trading Strategy
- King Keltner Trading Strategy
- Scalp Trading Methods
- LSS - An Introduction to the 3-Day Cycle Method
- Market Turns And Continuation Moves With The Tick Index
- The Money Manager Trading Strategy
- Picking Tops And Bottoms With The Tick Index
- The Super Combo Day Trading Strategy
- The Eleven Elliott Wave Patterns
- The Thermostat Trading Strategy
- Intraday trading with the TICK
- Traders Trick Entry
- Fibonacci Trader Journal
- Rapid Forex
- Microtrading the 1 Minute Chart
- BunnyGirl Forex Trading Strategy Rules and FAQ
- The Daily Fozzy Method
- Forex Traders Cheat Sheet
- Offset Trading
- How to Trade Both Trend and Range Markets by Single Strategy?
- A Practical Guide to Technical Indicators; Moving Averages
- FX Wizard
- FX Destroyer
- A Practical Guide to Swing Trading
- Practical Fibonacci Methods for Forex Trading
- Using The Heikin-Ashi Technique
- The Day Trade Forex System
- 5/13/62
- Not So Squeezy Trading Manual
- KobasFX Strategy
- Killer Patterns
- 3D Trading
- 4 Hour MACD Forex Strategy
- WRB Analysis Tutorial
Advanced Forex Trading
- A New Interpretation of Information Rate
- CCI Manual
- Nicktrader and Jeff Explaining Reverse and Regular Divers
- NickTrader on No Price CCI Divergence Trading
- Are Supply and Demand Driving Stock Prices?
- The Sharpe Ratio
- The Interaction Between the Frequency of Market Quotes, Spread and Volatility in Forex
- Trend Determination
- Trend vs. No Trend
- A Six-Part Study Guide to Market Profile
- How George Soros Knows What He Knows
- Core Point and Figure Chart Patterns
- Coders Guru Full Course
- Point and Figure Charting: a Computational Methodology and Trading Rule Performance in the S&P 500 Futures Market
- Evolving Chart Pattern Sensitive Neural Network Based Forex Trading Agents
- Heisenberg Uncertainty Principle and Economic Analogues of Basic Physical Quantities
- The String Prediction Models as an Invariants of Time Series in Forex Market
- Using Recurrent Neural Networks to Forecasting of Forex
- The New Elliott Wave Rule - Achieve Definitive Wave Counts