
[text]
Technical Analysis of AUD/NZD Dates 2014.12.18
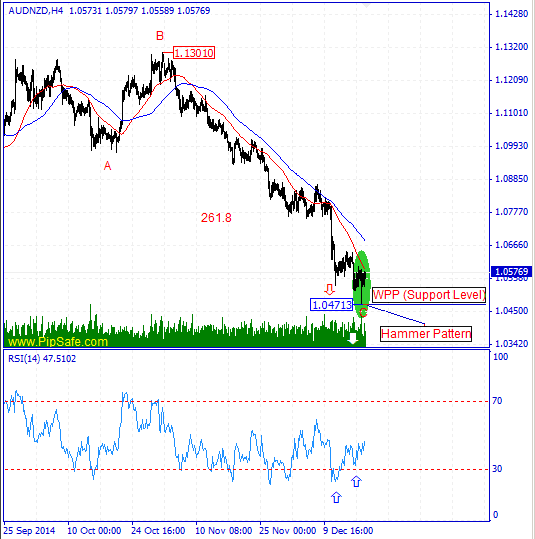
AUD/NZD during the recent weeks was in a strong and consistent downtrend that Sellers were successful in achieving the lowest price of 1.04713.Price has been stopped from more descend by reaching to the specified support levels(261.8 and WPP) in the picture below and with exit of some Sellers from their trades, the ideal Hammer (H4) and Spinning Top candlestick(Daily) patterns have been created. These candles shows vulnerability and indecision market in ascending or descending of price that for confirmation it needs closing of a bullish candle.
As it is obvious in the picture below, between the top price of 1.13010 and bottom price of 10.4713 there is ABC harmonic pattern with ratio of 261.8 that warns the potential of ascending from the C point of this pattern.RSI indicator is in saturation sell area in daily(also h4) time frame and in divergence mode with the price chart that warns about changing price direction during the next days. The first important warning for ascending of price is breaking of the 1.05998 resistance level(the highest level of price changes in previous day).
Written by the technical team of PipSafe Company
AUD/NZD Chart dated 2014.12.18
[/text]
Categories :
Tags : AUD AUD/NZD AUD/NZD News Forex Market Analysis NZD

