
AUD/USD Technical Analysis (2016.01.05)
The AUD/USD is trading better early Tuesday in reaction to steadier Chinese equities and improved consumer sentiment. The Forex pair posted a volatile trading session on Monday as investors dumped higher-yielding assets in the wake of a 7 percent decline in the CSI 300 and Shanghai Composite Index.
The catalyst behind yesterday’s weakness was a weak reading in the Caixin/Markit China Manufacturing Purchasing Managers’ Index (PMI). The report showed China’s factory activity contracted for the 10th straight month in December, and at a sharper pace than in November. The Aussie was underpinned slightly by the latest ANZ/Roy Morgan weekly consumer confidence survey, which climbed 0.8 percent.
Today’s direction will largely be dictated by the direction of the global equity markets. Look for a rally if there is renewed demand for higher-yielding assets.
Technically, the main trend is up according to the daily swing chart. However, yesterday’s price action shifted momentum to the downside.
The main range is .7384 to .7096. Its retracement zone at .7240 to .7274 is resistance.
The short-term range is .7096 to .7327. Its retracement zone at .72115 to .7184 is currently being tested.
Based on Monday’s close at .7189, the direction of the market today will likely be determined by trader reaction to the price cluster at .7184.
AUD/USD Chart
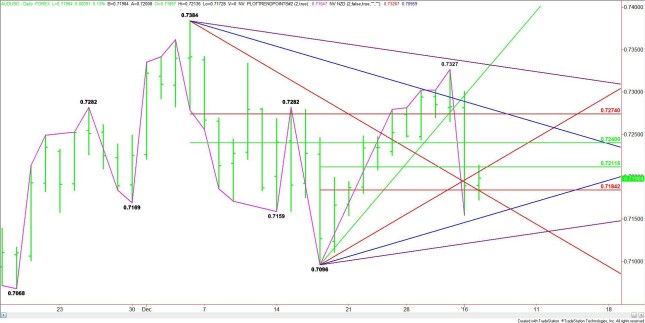
A sustained move over .7184 will signal the presence of buyers. The first upside targets are an uptrending angle at .7206 and the 50% level at .72115. These levels were tested earlier in the session.
Overcoming .72115 and holding above it could trigger an acceleration to the upside with the next target the main 50% level at .7240. The market will get even stronger over this level with the next potential target the main Fibonacci level at .7274. This is followed closely by a downtrending angle at .7284.
A sustained move under .7184 will indicate the presence of sellers. The first downside target is yesterday’s low at .7155. This is followed closely by an uptrending angle at .7151.
The daily chart opens up to the downside under .7151 will the next target an uptrending angle at .7124. This is the last potential support angle before the .7096 main bottom. A trade through this bottom will turn the main trend to down.
Watch the price action and read the order flow at .7184 today. Trader reaction to this price cluster will determine the direction of the market into the close.
Source: FXEMPIRE
Categories :
Tags : AUD/USD binary options trader forex bonus without deposit Forex Broker forex broker bonus forex learn forex learning forex learning pdf Forex Market Analysis forex tutorials for beginners pdf how to trade forex for beginners pdf learning forex trading pdf

