The best Forex strategies for get profit is scalper
Scalper is one way that traders use Forex, a commodity to trade in futures (futures). The philosophy of this method is hit and run! Taking the opportunity to take advantage of the momentum that is happening in the market, and leave after getting the desired profit. The scalper, always completing their transactions with stop loss (SL) and limit profit (TP), which usually are not too large (ranging between 30-50 points).
Stochastic indicator and moving averages (Simple Scalping using the Stochastic & MA)
To guide the transaction, the group usually uses stochastic indicator combined with lines of moving averages (MA). This trading method is suitable for the beginner trader or certain traders who deliberately limiting their margins (not wasteful margin).Stochastic is an indicator to determine the saturation point of the price.The terms related to these indicators are over bought (OB) and the over-sold (OS).
- OB is the state of the market to trend up (up), where prices began to lose impetus.
- Conversely OS is the situation in the market to trend down (down) where pressure on prices began to decrease.
An useful Look at Overbought/Oversold (Stochastic indicator with OB/OS alert)
In situations OB and OS, because the price is at the saturation point, frequent reversals, so many who take advantage of this momentum to market entry.Unfortunately, frequent misinterpretation of the OB market conditions and market conditions that led to the occurrence of any OS market position causing the loss (stop loss moved first). For example, if the market experienced OB, generally traders braced for entry SELL.
How to Trade with Stochastic Oscillator (Overbought/Oversold (OB/OS))
Conversely, if the market suffered OS, then the trader prepare for entry to BUY position. It’s certainly not wrong, because it is such a theory. However, conditions different OS and OB on the market with a side way trend (consolidation) with the condition of OS and OB on the market is bullish (up) and bearish (down).
How to Use Stochastic Indicator on bearish & bullish market?
On the market side with the trend way, not one entry SELL when prices in conditions of OB, is not wrong entry price BUY currently in a state of the OS. But if we apply this principle also in the market with a bullish or bearish trend, we are potentially losing money.
Why?
Because the market is bullish, if the stochastic is in the area 0-20 (below), this is the first sign will be a change from bullish to bearish, so it will be at risk if you take BUY position in this situation. Likewise, in the bearish market, if the position of the stochastic are in the area 80-100 (above), it is the initial symptom change in trend from bearish to bullish and is not recommended for entry to SELL position on this situation.
Then what kind of condition OB and OS on the market with a bullish and bearish trends?
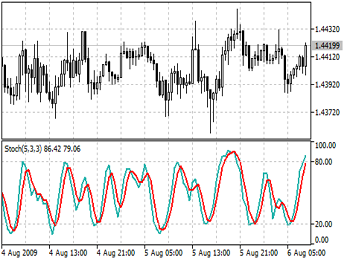
On the bullish trend, the condition occurs in the middle of the OS (this refers to the stochastic indicator display). Likewise, in the bearish market, OB condition occurs in the middle. Conditions OB / OS that means is when the blue line crosses the red lines on the display dotted stochastic indicator (blue line crosses the line OB dotted red from top to bottom, OS vice versa).
How to identify the condition OB / OS on the chart? (Swing Trading with Stochastic Indicator)
In the stochastic indicator (in this case I use TF 5 minutes on a pair XAU/USD) for one line in the middle (period / level 50). Line in the middle of this will serve as a pivot price movements. In a bull market, when prices fell to an area 0-20 (below), these are the first signs of price reversal will occur.
How to Use Stochastic Indicator for sell signals
Shortly after that the price will return to the central area (50). If the stochastic indicator experienced OB in the middle area of this (sometimes even less than in the middle area) and back swooping down (already left the center line), it’s time for SELL entry.
How to Use Stochastic Indicator for Buy Signals
Instead, the market is bearish, as prices rose to an area of 80-100 (above), these are the first signs of reversal will occur. Wait prices returned to the middle area (50). If the stochastic indicator experienced OS in this middle area (sometimes even less than in the middle area) and back heading up (had crossed the center line), it’s time to BUY entry.
By sudarmo sudarmo
Categories :
Tags : An useful Look at Overbought/Oversold binary options strategy pdf binary options trading pdf binary options trading strategies binary options trading strategy pdf How to identify the condition OB / OS on the chart? How to Trade with Stochastic Oscillator How to Use Stochastic Indicator for Buy Signals How to Use Stochastic Indicator for sell signals How to Use Stochastic Indicator on bearish & bullish market? Overbought/Oversold (OB/OS) pivot price movements Simple Scalping using the Stochastic & MA Stochastic indicator and moving averages Stochastic indicator with OB/OS alert Swing Trading with Stochastic Indicator The best Forex strategies for get profit is scalper trade in futures Trade with Stochastic Oscillator trading binary options strategies and tactics pdf free

