A Practical Guide to Swing Trading – An Introduction to Swing Trading -To make money in the stock market it is necessary to have a disciplined approach to trading. We also believe that it is also important to keep things simple. While our goal is to keep things simple, the trading rules might initially seem a bit complex. However, once you learn the rules and you trade with discipline, you will make money in the stock market.
Swing trading allows you to make money when the market is bullish, or bearish, or just going sideways. That is why it has a distinct advantage over other approaches to investing. The goal is to make money, not to rest one’s hopes on the future of a stock, a sector, or the economy.
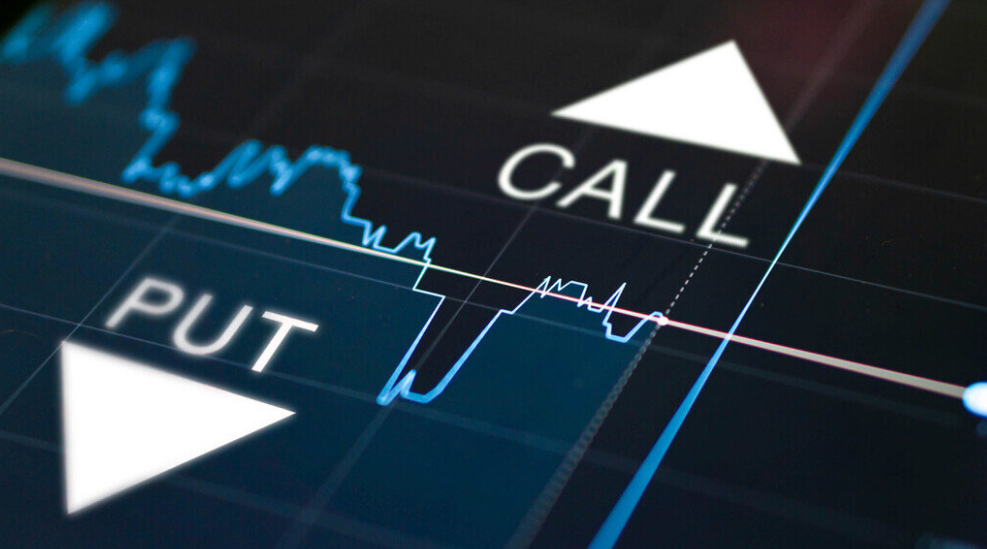
What is Swing Trading
Everyone is familiar with waves. A wave alternates from positive to negative, then to positive and negative, and so on. Waves are found in nature – you see waves when you throw a rock into a lake. Sound is transmitted in waves. And when stock prices change, they follow a wave-like pattern. The wave is rarely as orderly a sine wave, but they are waves nevertheless, and we use these waves in Swing Trading.
Let’s Look at an Up Trends
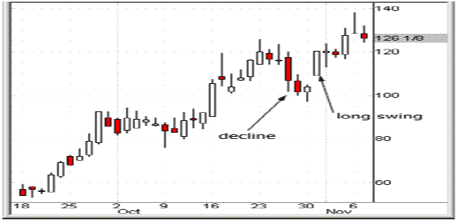
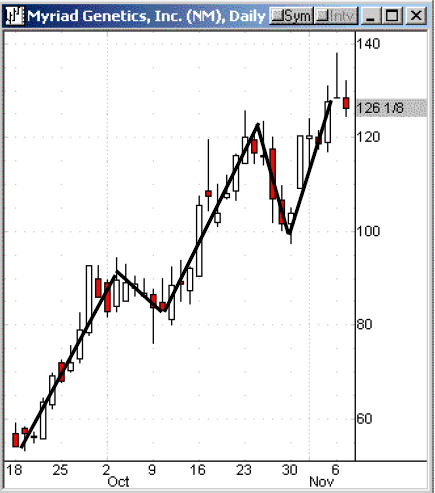
The chart below shows the price movement of Myriad Genetics (MYGN) in an uptrend. Notice that after the price moves up, it takes a rest, or pulls back. When we swing trade an uptrend, we buy on the pull-back.
An uptrend can be identified by a series of higher highs and higher lows (the bottom of each pull-back). In other words, an uptrend is a series of successive rallies with each rally going higher than the previous one and each pull-back stopping above the previous one.
The price movement looks more like the zig-zag of a saw blade than a sinusoid, but once an uptrend is established the pattern tends to repeat itself. In swing trading we capitalize on the predictability of the pattern. We buy during the pull-back to increase our chances of making a profit.
Let’s Look at a Down Trend
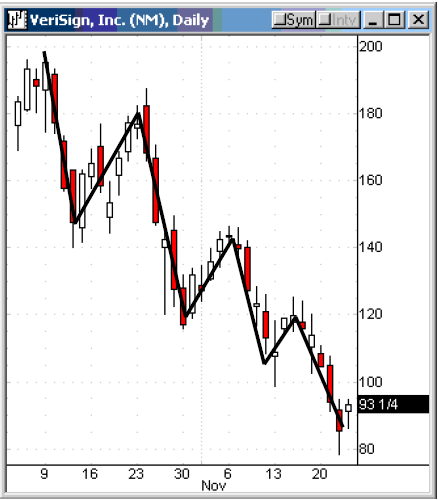
The chart below shows the price movement of Verisign (VRSN) in a downtrend. Notice that after the price moves down, it takes a rest, or pulls up. The price movement follows a zig zag pattern.
A downtrend can be identified by a series of lower lows and lower highs (the peak of each pull-up).
When we swing trade a downtrend, we sell short during a pull-up. If you are unfamiliar with selling short, we discuss it in the next session.
The Steps in Swing Trading
First, restrict your selection to the universe of stocks that fulfill certain criteria. Choose stocks that …
• Have a price of at least $7
• Have an average daily volume of at least 500,000 shares
Then …
STEP 1 – Identify a stock that is in an uptrend or a downtrend.
STEP 2 – For stocks in an uptrend, identify those that are experiencing a pull-back. For stocks in a downtrend, identify those that are experiencing a pull-up.
STEP 3 – Once an appropriate candidate is identified, place a limit order to buy (uptrend) or sell short (downtrend) the stock based on the Master Plan.
STEP 4 – Once a stock has been traded (a position opened), place a stop-loss order to limit downside risk and place a limit order to identify the price at which you will take profits. (Ideally, these two orders are placed together as anOCO (One Cancels Other) order; this is sometimes called an OCA (One Cancels All) order.
STEP 5 – At the end of each day, adjust the stop loss prices based on the Master Plan.
What Can You Expect?
First – only a portion of your trades will be executed. The Master Plan is designed to only trade stocks that initially move in the anticipated direction. If the price moves in the opposite direction (continues pulling back or pulling up), the trade is not placed.
Second – you will be holding positions for a limited amount of time. While swing trading is not day trading, you are only holding positions until targets are met.Third – some of your trades will result in losses, however losses are minimized by the Master Plan which raises the stops as the stock price rises; this is known as trailing stops. Being disciplined, and following the Master Plan will insure that profits exceed losses which means you will make money.
How Do You Identify Stocks that are Appropriate for Swing Trading?
All of the methods that are used to identify stocks that are appropriate for swing trading are based on technical analysis. Technical analysis is a way of using historical price/volume patterns to predict future behavior. It is not necessary to have a detailed understanding of technical analysis in order to swing trade. There are tools available that can assist investors at every level – from novice to expert. While there are many sources of information and tools that help identify swing trading opportunities, this book will focus on those provided at www.mrswing.com. Once you understand the principles, you can explore other sources of information.
Pattern Recognition Criteria
While looking at a chart can often tell you whether a stock is appropriate for swing trading, it is very time consuming to look at charts, particularly if you look for opportunities every day. Another way to identify good stocks is to use software that can scan all of the listed stocks based on a series of algebraic equations that represent the characteristics of a good chart pattern. I use SwingTracker to accomplish this task.
Before discussing the specifics of pattern recognition criteria, we’ll briefly consider the measures used in the algebraic equations. Some of the measures are simple descriptive variables (e.g., the high price for the previous day or the average volume over the past 20 days). Other measures are based on technical analysis which is discussed in more detail in the Appendix. Technical analysis has many different indicators from a simple moving average to a complex oscillator. It is not necessary to have an in-depth understanding of technical analysis to be a successful swing trader, however, it is helpful to have a rudimentary understanding of how we approach swing trading pattern recognition.
Technical Analysis Measures used to Recognize Swing Trading Patterns
To begin with, we typically restrict our selections to stocks that are at least $12 in price, having an average (20 day) daily volume of at least 500,000 shares. Since market makers can more easily manipulate low price, low volume stocks, we stay away from them.
For long swings we are interested in identifying stocks that are in an uptrend. One of the indicators we use is a simple moving average (SMA). A moving average is simply the average closing price for a particular number of days. It’s called a moving average because on each new day, the current day’s price is added to the average while the oldest price is dropped. We typically focus on three moving averages, those based on 10 days, 20 days and 50 days. All moving averages smooth the price movement and make it easier to identify trends. It is also significant to know where today’s price is relative to the moving averages and whether the shorter time-frame moving average is above or below the longer time-frame moving average. Two indicators that a stock is in an uptrend are:
-Today’s closing price is above both the 10-day and 20-day moving averages
-The 10-day moving average is above the 20-day moving average
When looking for a long swing, we would like to identify stocks that are experiencing a brief decline (pullback). We can identify a 3-day pullback as follows.
• Today’s high price is lower than yesterday’s high
• Yesterday’s high is lower than the high the day before
We also use a technical indicator developed by Dr. Alexander Elder called the Force Index. This index combines the magnitude of the price change with the direction of the change and the trading volume. In order to confirm the relative force behind an uptrend and a pullback, we use a 3-day moving average and a 13-day moving average of the Force Index. The following conditions demonstrate that the bears have been winning the short-term battle while bulls are dominating the longer frame:
• The 3-day moving average of the Force Index is less than 0, and
• The 13-day moving average of the Force Index is greater than 0
Another technical indicator we like to use is the Directional Movement Index (DMI) that was developed by J. Welles Wilder Jr. It is used to determine whether a stock is trending or not trending (i.e., moving sideways). In SwingTracker we provide the two components of this indicator – the Positive Directional Index (+DI) and the Negative Directional Index (-DI) – along with a 20-day moving average based on these two measures (ADX). An uptrend is confirmed if …
• ADX is higher than 30
• +DI is greater than –DI
WHAT is the Master Plan
The Master Plan is a set of rules that determines when to enter and exit a trade. At first, it might seem a little complicated, but once you have place a few trades using the system, you’ll realize it’s really quite simple. The best part about the Master Plan is that you don’t need to use judgment. The rules are mechanical. Two obstacles to successful trading are the human emotions of fear and greed. By following the Master Plan, these emotions will not influence your behavior, nor will they interfere with your success.
To keep it simple, we’ll first focus on the long trade. The rules for a short trade are simply the mirror image of the rules for a long trade. An example of a long swing opportunity is shown below. The price has declined (pulled back) and you are bullish on the stock.

Taking a Profit and Preserving Capital
An important aspect of the Master Plan is setting a profit target and preserving capital. The approach is fairly conservative – the profit target is approximately 7% with a potential loss capped at 4%. The actual profit is likely to be more than 7% while a loss is likely to be smaller than 4%. Here’s how it works.
• Once the target price is reached (7% above the entry price), half of the shares are sold, locking in a 7% profit. The other shares remain invested to benefit from any further increase in price.
• If the price moves against the trade, the maximum loss tolerated is 4%. This preserves capital for future trades.
• Typically, more trades will produce a profit than a loss. The net result is profit.
• The movement of the entire market is very powerful. When the market is moving with your trades, a very high percentage of your trades will be profitable.
• When the entire market is moving against your trade, a higher than expected percentage of your trades will lose. The stop loss protects you from excessive losses.
Profit is taken using a “sell limit” order – once the price is reached, the specified number of shares are sold.
Capital is protected using a “stop loss” order – when the stop price is reached, all the shares are sold.
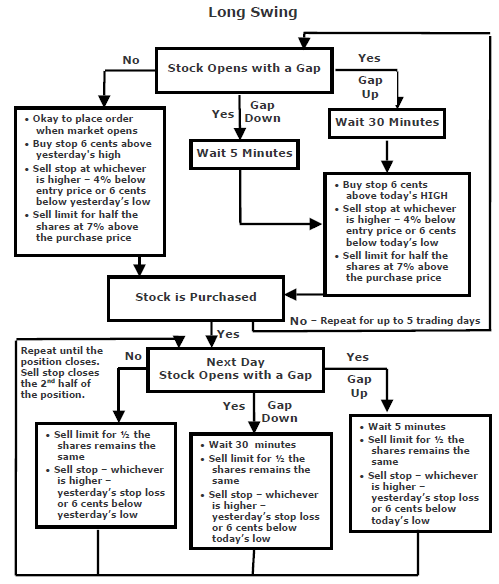
When to Enter the Trade
Using the Master Plan, swing trading opportunities are identified after the market closes. Trades are entered in the morning, usually within the first half hour of trading. When you enter the trade (and the decision rule you use) depends on whether or not the stock has gapped up or down from the previous day’s closing price. According to the Master Plan, a stock is considered to have gapped up when it opens 50 cents or more higher than the previous day’s close; it is considered to have gapped down when it opens 50 cents lower than the previous day’s close. Most frequently, the stock price will open within 50 cents of the previous day’s close, neither gapping up nor gapping down.
• The most common occurrence – the stock opens within 50 cents ($0.50) of the previous day’s close – the order can be placed a few minutes after the market opens.
• Occasionally a stock gaps up 50 cents or more compared to the previous day’s close – the order is placed at least 30 minutes after the market opens.
• Occasionally a stock gaps down 50 cents or more compared to the previous day’s close – the order is placed approximately 5 minutes after the market opens.
• To summarize, if the stock gaps in the same direction as the trade, wait 30 minutes, and if the stock gaps in the opposite direction of the trade, wait 5 minutes.
How to Enter the Trade
As with when to trade, how to enter depends on whether the stock gaps up/down or not. Typically, the stock price doesn’t gap up or down and the entry price is based on the previous day’s prices. When the stock gaps up or down, the entry price is not based on the previous day’s prices, but on the current day’s prices. Whether based on the previous day’s prices or the current day’s prices, the entry rules are the same.
• The most common occurrence – the stock opens within 50 cents ($0.50) of the previous day’s close – buy the stock the moment it trades 6 cents (1/16) above the previous day’s high. This can be accomplished by using a buy stop order. This increases the likelihood that the price is moving in the direction of the bullish (long) trade.
• Occasionally a stock gaps up or down 50 cents or more – buy the stock the moment it trades 6 cents above the high of the new day. This would be 30 minutes after the market opens for a gap up or 5 minutes after the market opens for a gap down.
What to do After the Trade is Executed
Once the trade is executed, the exit orders are placed.
• The profit order – a sell limit order is placed at a price that is 7% above the entry price.
• The capital preservation order – a sell stop (stop limit) order is placed at 4% below the entry price OR 6 cents below the low of the day that was used for the trade (whichever is higher) – for a stock that opened without a gap the previous day sets the prices; for a stock that opened with a gap, the price action before the day (high and low) sets the prices.
What to do the Day After the Trade is Executed
As with when to trade and how to enter, the following day’s activity depends on whether the stock gaps up/down or not. If the stock price doesn’t gap up or down, the stop loss is changed based on the previous day’s prices. If the stock gaps up or down, the stop loss is changed based on the current day’s prices. Whether based on the previous day’s prices or the current day’s prices, stop loss rule is the same.
• When the stock opens within 50 cents ($0.50) of the previous day’s close – if 6 cents below the previous day’s low is higher than yesterday’s stop loss, raise the stop loss to this new price. This is known as raising the trailing stop, which further limits the downside risk.• When the stock gaps up or down 50 cents or more – wait 30 minutes for a gap down or 5 minutes for a gap up – if 6 cents below the today’s low is higher than yesterday’s stop loss, raise the stop loss to this new price.
What happens if the Trade is Not Executed
Let’s say that you are receiving recommendations from MasterSwings or MrSwing Lite and your trade is not executed on the day the order is placed. You can repeat the process for up to 5 trading days.
• If the stock gaps up or down, wait the appropriate amount of time (30 minutes for a gap up and 5 minutes for a gap down) – determine the entry and exit prices based on the current day’s prices.
• If the stock opens within 50 cents of yesterday’s close, the entry and exit prices are based on the previous day’s prices.
The chart on the following page should make the trading rules clear.
Once half the shares close at a 7% profit, the other half remains open to “ride the wave”. When do we close the second half of the trade?
A trailing stop is used to close the 2nd half of the trade. Remember that a trailing stop is used to raise the sell stop (stop loss) during the trade. The same rules apply (see 6.6 above). The shares are sold when the price drops to 6 cents below the low of previous day (no gap on open) or the current day (gap on open).
To read More,Please Download The Book.
by Larry Swing
A Practical Guide to Swing Trading, A Practical Guide to Swing Trading eBook, binary options learn, binary options strategy pdf, binary options trader, binary trading strategies pdf, Down Trend, Download A Practical Guide to Swing Trading, forex trading learn, learn binary, learn forex market, learn forex market trading, learning forex trading online, SMA, stock market, Swing Trading, swing trading pattern recognition, Swing Trading Patterns, trading binary options strategies and tactics pdf free, Up Trends, zig-zag
Similar Videos and E-books


LEAVE A COMMENT
All Books
For Beginners
- Candlesticks For Support And Resistance
- Online Trading Courses
- Commodity Futures Trading for Beginners
- Hidden Divergence
- Peaks and Troughs
- Reverse Divergences And Momentum
- Strategy:10
- The NYSE Tick Index And Candlesticks
- Trend Determination
- The Original Turtle Trading Rules
- Introduction to Forex
- The Six Forces of Forex
- Study Book for Successful Foreign Exchange Dealing
- Forex. On-Line Manual for Successful Trading
- 18 Trading Champions Share Their Keys to Top Trading Profits
- The Way to Trade Forex
- The Truth About Fibonacci Trading
- Quick Guide to Forex Trading
- Chart Patterns and Technical Indicators
- Forex Trading
- Trading Forex: What Investors Need to Know
- My Dog Ate My Forex
- Point & Figure for Forex
Forex Market in General
- Screen Information, Trader Activity, and Bid-Ask Spreads in a Limit Order Market
- Strategic experimentation in a dealership market
- Limit Orders, Depth, and Volatility
- Reminiscences of a Stock Operator
- Market Profile Basics
- Quote Setting and Price Formation in an Order Driven Market
- Phantom of the Pits
- An Introduction to Market Profile and a Users Guide to Capital Flow Software
- The Effect of Tick Size on Volatility, Trader Behavior, and Market Quality
- Trading as a Business
- What Moves the Currency Market?
- Macroeconomic Implications of the Beliefs and Behavior of Foreign Exchange Traders
- All About the Foreign Exchange Market in the United States
Psychology of Trading
- A Course in Miracles
- Thoughts on Trading
- Calming The Mind So That Body Can Perform
- Lifestyles of the Rich and Pipped
- The Miracle of Discipline
- Zoom in on Personal Trading Behavior And Profit from It
- The Woodchuck and the Possum
- 25 Rules Of Forex Trading Discipline
- Stop Losses Are For Sissies
- Your Personality and Successful Trading
- Trading as a Business
- The 7 Deadly Sins of Forex (and How to Avoid Them)
- The 5 Steps to Becoming a Trader
Money Management
- Risk Control and Money Management
- Money Management
- Position-sizing Effects on Trader Performance: An experimental analysis
- Fine-Tuning Your Money Management System
- Money Management: Controlling Risk and Capturing Profits
- Money Management Strategies for Serious Traders
- The Truth About Money Management
- Money Management and Risk Management
Forex Strategy
- 1-2-3 System
- Bollinger Bandit Trading Strategy
- Value Area
- The Dynamic Breakout II Strategy
- Ghost Trader Trading Strategy
- King Keltner Trading Strategy
- Scalp Trading Methods
- LSS - An Introduction to the 3-Day Cycle Method
- Market Turns And Continuation Moves With The Tick Index
- The Money Manager Trading Strategy
- Picking Tops And Bottoms With The Tick Index
- The Super Combo Day Trading Strategy
- The Eleven Elliott Wave Patterns
- The Thermostat Trading Strategy
- Intraday trading with the TICK
- Traders Trick Entry
- Fibonacci Trader Journal
- Rapid Forex
- Microtrading the 1 Minute Chart
- BunnyGirl Forex Trading Strategy Rules and FAQ
- The Daily Fozzy Method
- Forex Traders Cheat Sheet
- Offset Trading
- How to Trade Both Trend and Range Markets by Single Strategy?
- A Practical Guide to Technical Indicators; Moving Averages
- FX Wizard
- FX Destroyer
- A Practical Guide to Swing Trading
- Practical Fibonacci Methods for Forex Trading
- Using The Heikin-Ashi Technique
- The Day Trade Forex System
- 5/13/62
- Not So Squeezy Trading Manual
- KobasFX Strategy
- Killer Patterns
- 3D Trading
- 4 Hour MACD Forex Strategy
- WRB Analysis Tutorial
Advanced Forex Trading
- A New Interpretation of Information Rate
- CCI Manual
- Nicktrader and Jeff Explaining Reverse and Regular Divers
- NickTrader on No Price CCI Divergence Trading
- Are Supply and Demand Driving Stock Prices?
- The Sharpe Ratio
- The Interaction Between the Frequency of Market Quotes, Spread and Volatility in Forex
- Trend Determination
- Trend vs. No Trend
- A Six-Part Study Guide to Market Profile
- How George Soros Knows What He Knows
- Core Point and Figure Chart Patterns
- Coders Guru Full Course
- Point and Figure Charting: a Computational Methodology and Trading Rule Performance in the S&P 500 Futures Market
- Evolving Chart Pattern Sensitive Neural Network Based Forex Trading Agents
- Heisenberg Uncertainty Principle and Economic Analogues of Basic Physical Quantities
- The String Prediction Models as an Invariants of Time Series in Forex Market
- Using Recurrent Neural Networks to Forecasting of Forex
- The New Elliott Wave Rule - Achieve Definitive Wave Counts

