
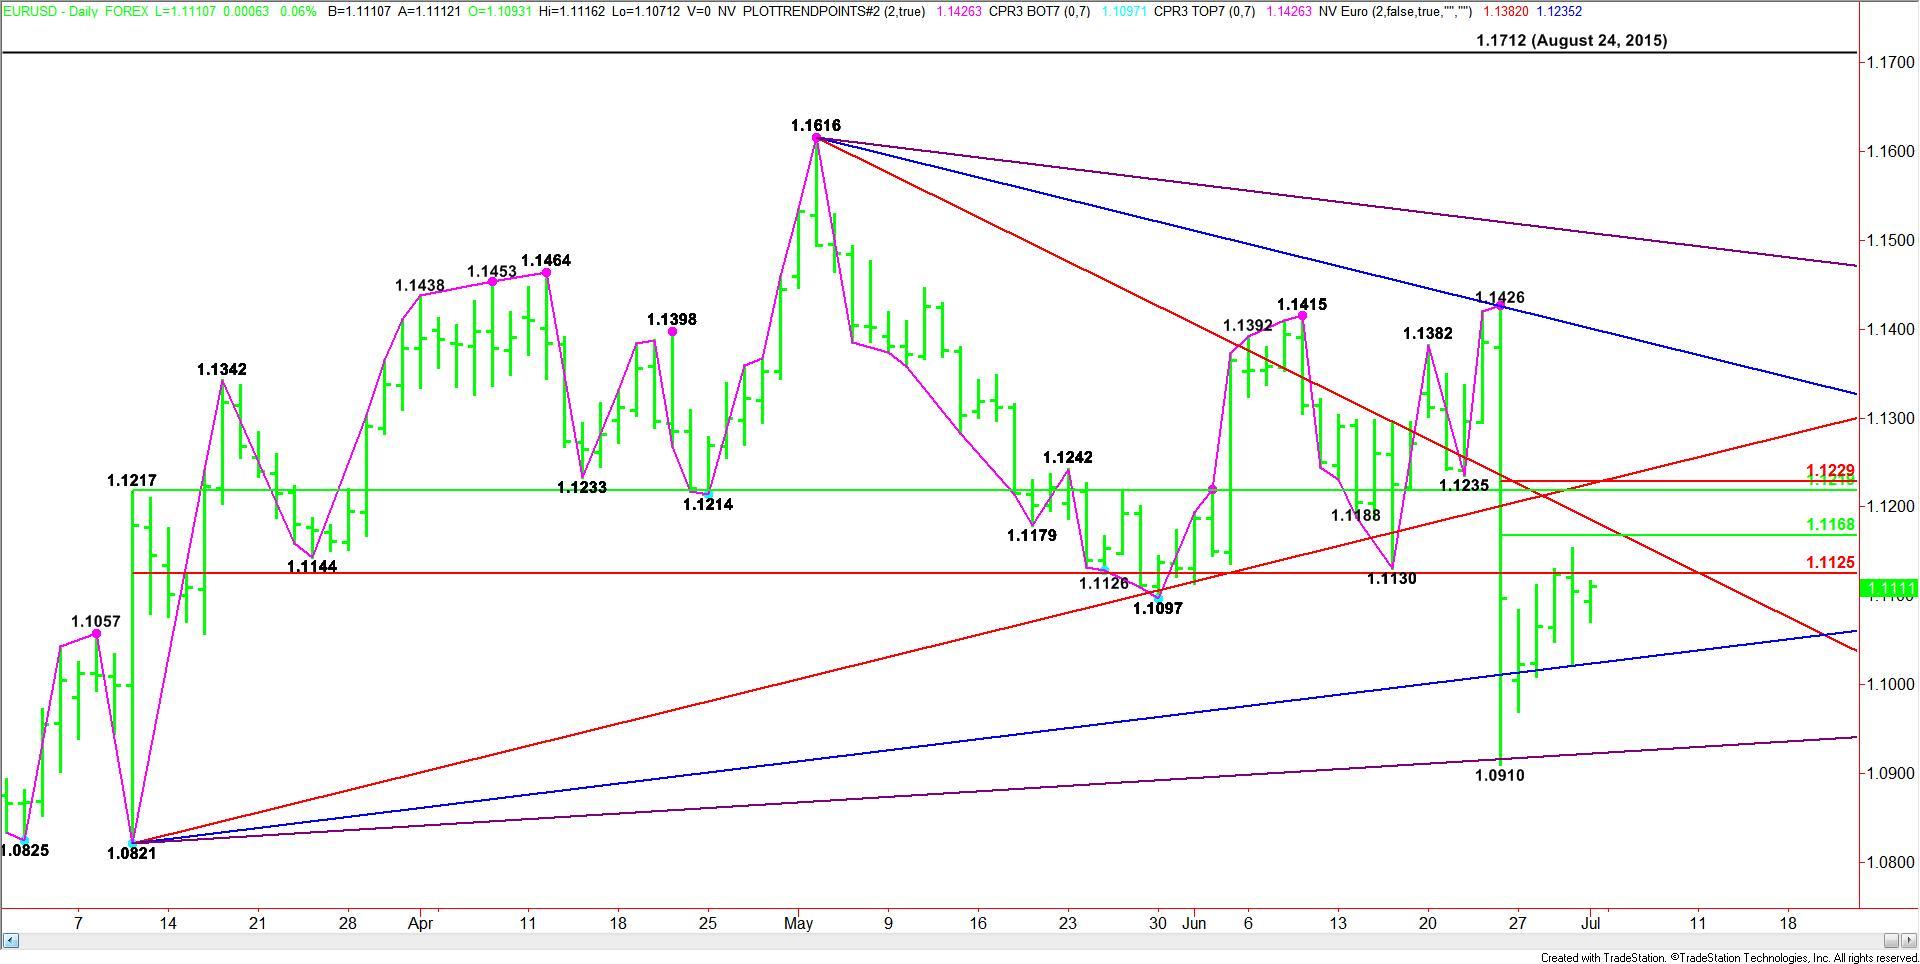
EURUSD Analysis – EUR/USD rose initially during the course of the day on Friday, but turned right back around to form a fairly negative candle. It makes sense, because we continue to bang around in a consolidation area, and I believe that we are essentially bouncing between the 1.10 level on the bottom, and the 1.12 level on the top. I do think that eventually we break down, but having said that we will have to have some type of trader to start selling. Short-term rallies continue to be selling opportunities on short-term charts as far as I can tell.
EUR/USD Chart
The EUR/USD is trading higher at the mid-session. The Forex pair is also posting an inside move which suggests investor indecision and impending volatility.The main trend is down according to the daily swing chart. However, momentum has been slightly to the upside since the 1.0910 main bottom on June 24.A trade through the last minor top at 1.1186 won’t change the main trend to up, but a move through this level could trigger an acceleration to the upside if it hits enough buy stops or if buying volume increases on the move.The main range is 1.1426 to 1.0910. Its retracement zone at 1.1168 to 1.1229 is the primary upside target. Yesterday, the rally stopped just short of the lower or 50% level at 1.1164. This zone essentially stopped the rally on July 5 at 1.1186.This zone is important to the longer-term structure of the market. Since the trend is down, sellers are going to continue to sell rallies into it until enough buyers show up to take out the zone.
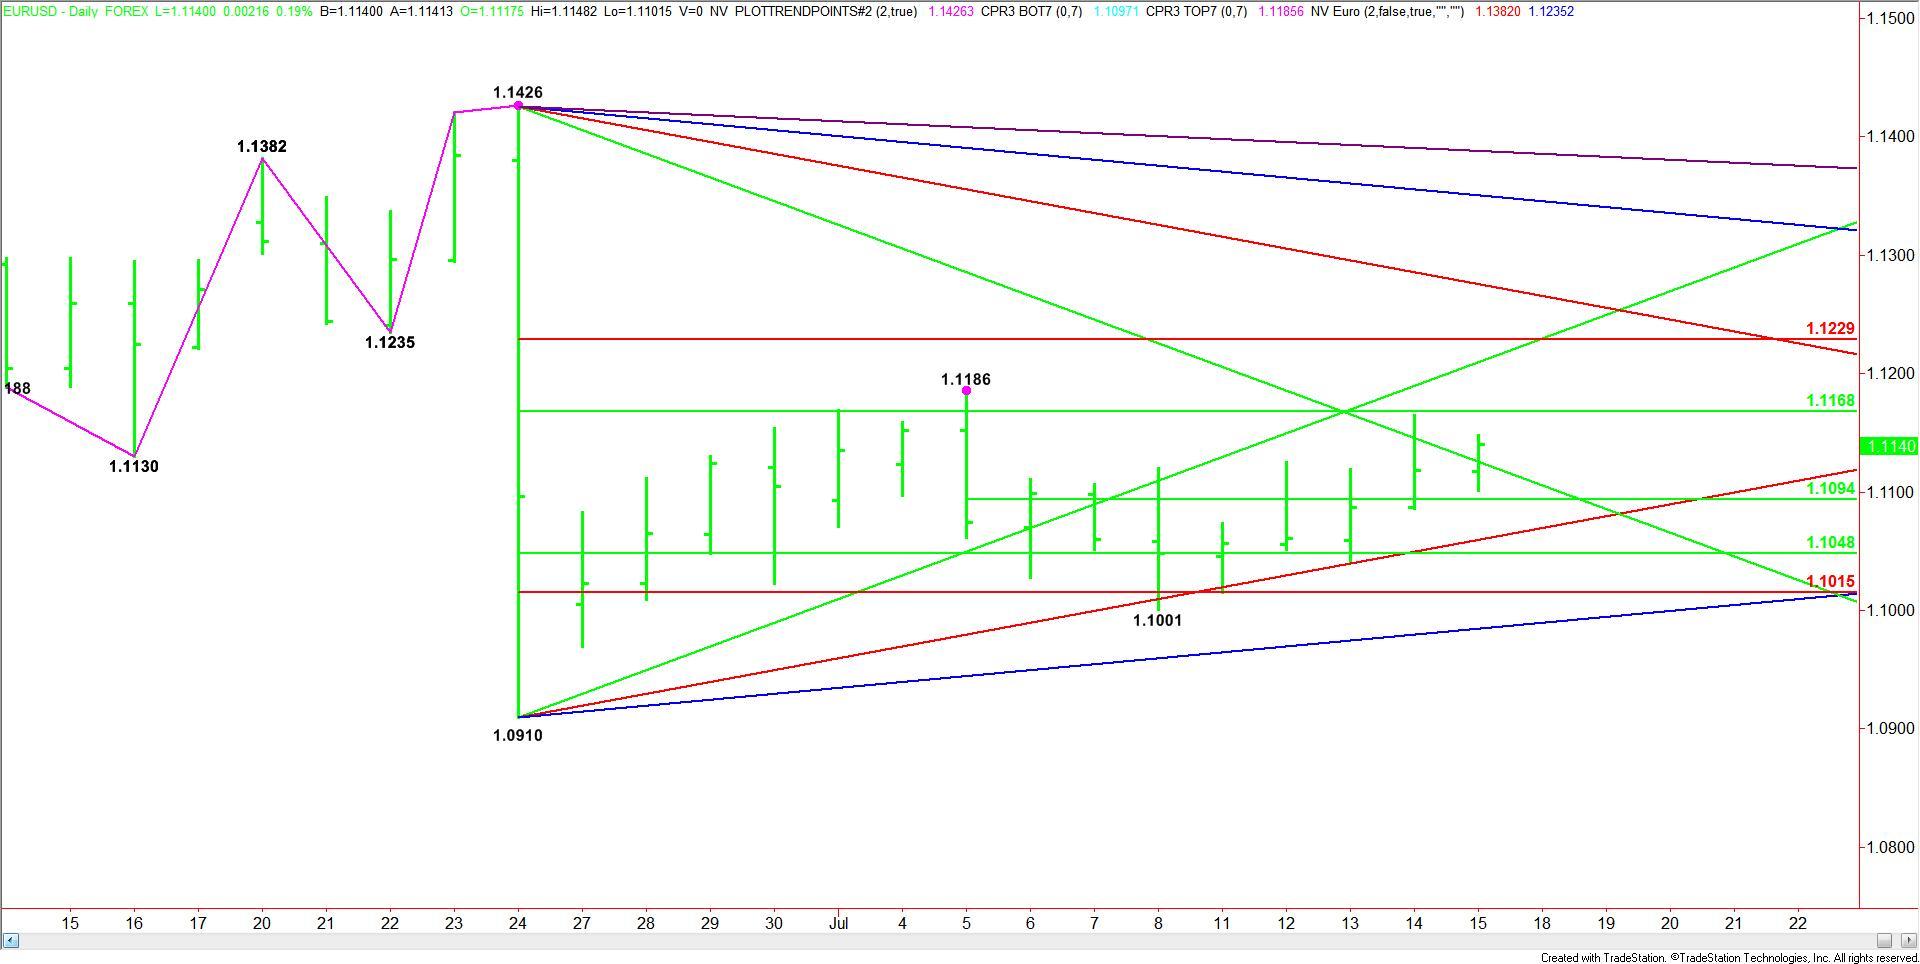
Based on the current price at 1.1137, the direction of the market today is likely to be determined by the downtrending angle at 1.1126.A sustained move over 1.1126 will indicate the presence of buyers. This could create enough upside momentum to challenge the 50% level at 1.1168. This is a potential trigger point for a surge into 1.1210 then the Fib level at 1.1229.A break back under 1.1126 will signal the presence of sellers. The first target is a short-term pivot at 1.1094. The chart opens up to the downside under this level with the next target angle coming in at 1.1060. This angle has held three times over the past two week and is very important to the structure of the current rally.Watch the price action and read the order flow at 1.1126 today. Trader reaction to this angle will tell us if the buyers are still supporting the rally, or if the sellers are taking control.
Source: FXEMPIRE
Categories :
Tags : binary options trader EUR/USD EUR/USD Chart eurusd analysis forex bonus without deposit Forex Broker forex broker bonus forex learn forex learning forex learning pdf Forex pair forex tutorials for beginners pdf how to trade forex for beginners pdf learning forex trading pdf

