
[text]
Technical Analysis of Gold Dates 2014.12.02
Gold Technical Analysis
Written by the technical team of PipSafe Company
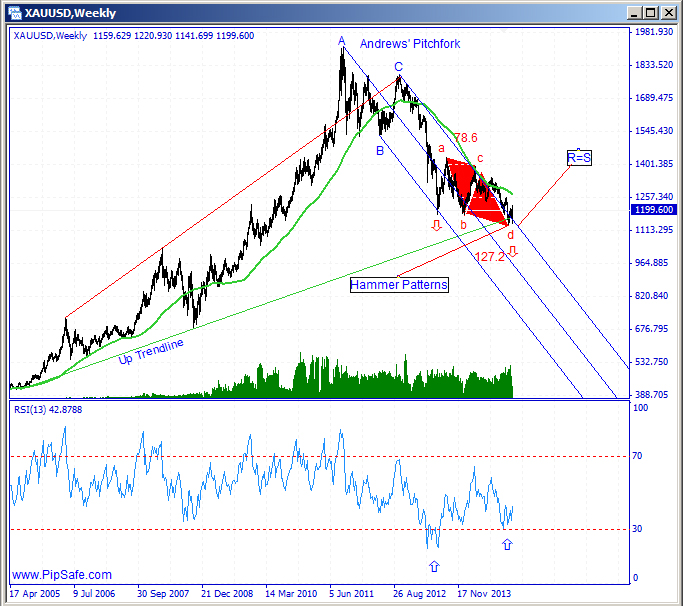
As it is mentioned in previous technical analysis of this metal in 17.11.2014, according to the symbols that were formed in the chart, it was possible that the price in this metal decreases and finally it happened(max=1220.872). Price during the downfall with reaching to the Up Trendline(made of 2 bottom prices) and support level (R=S) of Andrews’ Pitchfork has stopped from more descend and has formed a bottom price(Hammer patterns) in the level of 1132.765.
As it is obvious in the picture below, price with formation of AB=CD harmonic pattern with ideal ratios of 76.8 and 127.2 has prepared the field for ascending of the price from bottom price of 1132.765 that finally happened.RSI indicator in weekly time frame is in saturation sell area and in divergence mode with the price chart that with the next cycle confirms the current bottom price and warns about the potential of ascending during the next candles.The first important warning for descending of the price is breaking of Up Trendline. Generally until the bottom price of 1132.765 is preserved, there is the possibility of increase and ascend of price.
Gold Chart 2014.12.02
[/text]
Categories :
Tags : 76.4=127.2 AB=CD forex bonus without deposit Forex Broker forex broker bonus forex learn forex learning forex learning pdf forex tutorials for beginners pdf Gold Gold Chart Hammer how to trade forex for beginners pdf learning forex trading pdf

