
[text]
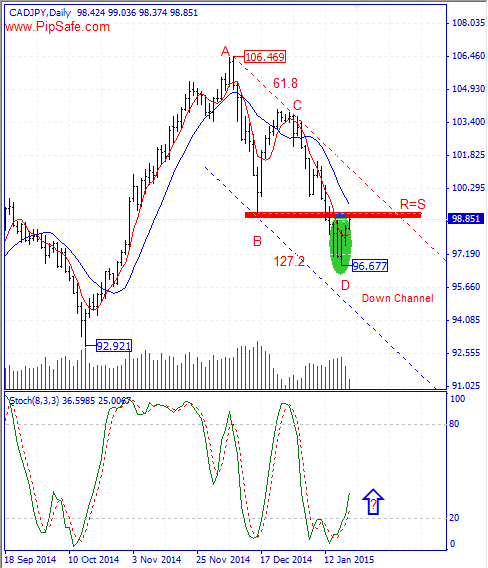
CAD/JPY from the top price of 106.649 till now was in a downtrend that sellers were able to achieve the lowest price of 96.677.Price by reaching to the round support level of 97.000 has stopped from more descend that shows Sellers used this price level to exit their trades.According to the formed movements in the chart, there is AB=CD harmonic pattern with none-ideal ratios of 61.8 and 127.2 between top price of 106.649 and the bottom price of 96.677 that warns about the potential of ascending from the endpoint of this pattern and on the whole has been prevented from more decrease till now.
Stoch indicator in daily time frame is in saturation sell area and with the next cycle warns about ascending of price during the next candles, but because of lack of coordination with the weekly and monthly time frames is not much valid.According to this point that in long term time frames such as weekly and monthly, price is under 5-day moving average and there is not any clear reason for ascending of the price, if the price level of 96.677 breaks, the price will find a potential for going toward the targets such as the important round level of 96.000 .
Written by the technical team of PipSafe Company
CAD/JPY Chart
[/text]
Categories :
Tags : 61.8=127.2 AB=CD AB=CD harmonic pattern CAD/JPY CAD/JPY News forex bonus without deposit Forex Broker forex broker bonus Forex Daily Analysis forex learn forex learning forex learning pdf Forex Market News Forex News forex tutorials for beginners pdf how to trade forex for beginners pdf learning forex trading pdf

