
[text]
Technical Analysis of AUD/USD Dates 2014.12.16
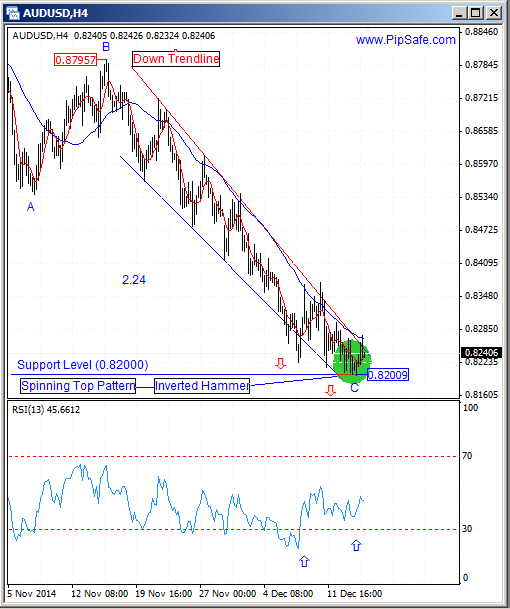
AUD/USD was in a strong and consistent downtrend during the recent weeks that sellers were successful in obtaining the lowest price of 0.82000. price with reaching to the supportive level which is shown in the picture below ( made of 4 bottom prices) and the important round level of 0.82000 has stopped from more descend( sellers used this level to exit their trades) and with formation of a bottom price in H4 time frame has prepared a field for ascending of price.
As it is obvious in the picture below, between the top price of 0.87957 and bottom price of 0.82009 there is ABC harmonic pattern with ratio 2.24 that warns the potential of ascending from the C point of this pattern.RSI indicator is in saturation sell area in daily and H4 time frame that confirms the harmonic C point and warns about changing price direction during the next candles.Generally until the bottom price of 0.82009 is preserved, the price has the potential for ascending in this currency pair.
Written by the technical team of PipSafe Company
AUD/USD Chart dated 2014.12.16
[/text]
Categories :
Tags : ABC Pattern AUD AUD/USD forex bonus without deposit Forex Broker forex broker bonus forex learn forex learning forex learning pdf Forex Market Analysis forex tutorials for beginners pdf how to trade forex for beginners pdf learning forex trading pdf

