
[text]
Gold Futures Technical Analysis
June Comex Gold closed higher after early session weakness on Wednesday. The market rebounded after the Fed issued somewhat dovish minutes from its April meeting. The minutes may be an indication that the Fed will skip a June rate hike. This could lead to a weaker dollar which could underpin gold prices.
The main trend is up on the daily chart. The main range is $1168.40 to $1232.00. Its retracement zone is $1200.20 to $1192.70. An uptrending angle passes through this zone at $1196.40 today, making it a valid target also. Yesterday, the market stopped short of the 50% level at $1200.20 when it traded $1202.70.
During the pre-market session, gold traded on the bullish side of a downtrending angle at $1208.00. This could be a sign that the market is setting up for a short-term rally.The short-term range is $1232.00 to $1202.70. This makes its retracement zone at $1217.40 to $1220.80 the primary upside target. A downtrending angle passes through this zone at $1220.00, making it a valid upside target also.
Overtaking $1220.80 will put the market in an extremely strong position with other targets at $1224.40 to $1226.00.On the downside, a failure at $1192.70 could trigger further weakness into $1188.40 to $1187.20.The tone of the market will be determined by trader reaction to the angle at $1208.00. A sustained move over this angle is likely to trigger a rally into $1217.40. A failure to hold $1208.00 will likely lead to a test of $1200.20.
Gold Chart
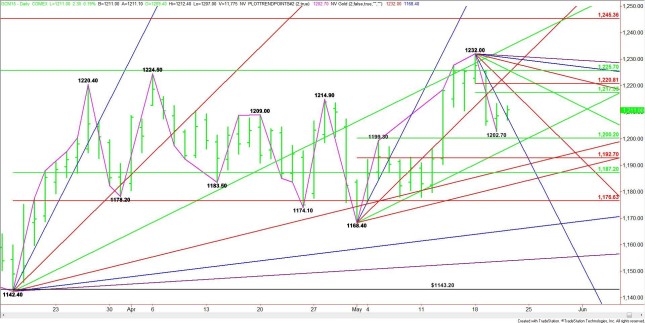
Source: Fxempire
[/text]
Categories :
Tags : Analysis of gold binary options trader Gold Gold NEWS

