
Gold Technical Analysis – Gold markets went back and forth during the day on Tuesday, but eventually settled on something akin to a hammer. It looks as if we are trying to break out to the upside but we may have to build up enough momentum to finally shatter the $1300 resistance barrier. Because of this, I believe that the market will be one that you can buy on dips, and selling will be very difficult to do because there so much bullish pressure underneath. With this, I believe that patience will be required in order to profit from the breakout.
prices continue to gain traction rising for a 6th consecutive trading session, and poised to test the May highs at 1,304. Softer than expected U.S. Retail Sales helped buoy the price of the yellow metal. Support on gold is seen near the 10-day moving average at 1,252. Momentum is positive as the MACD (moving average convergence divergence) index prints in the black with an upward sloping trajectory which points to higher prices for the yellow metal. The RSI (relative strength index) moved higher with price action reflecting accelerating positive momentum.U.S. retail sales rose 0.5% in many with the ex-auto component up 0.4%, a little softer than forecast. There were no revisions to the 1.3% headline gain in April and the 0.8% ex-auto gain. Sales excluding autos, gas, and building materials increased 0.5% versus 0.9% previously.
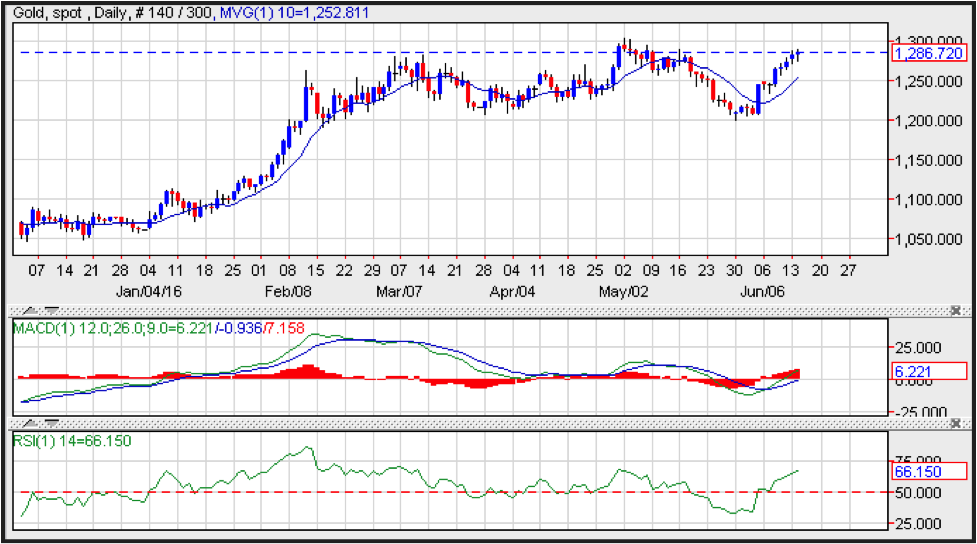
Source: FXEMPIRE
Categories :
Tags : Gold & Oil News and Analysis Gold Technical Analysis MACD RSI U.S. retail sales

