
Gold Technical Analysis – The gold markets initially fell during the course of the day on Friday, but did bounce off of the $1340 level to form a bit of a hammer like candle. With this, it appears that the market should continue to go higher given enough time but we also have a shooting star on the weekly charts that suggests perhaps we may need to pull back a little bit. Either way, I am “long only” when it comes to the gold markets, and will either buy breakouts to the upside or supportive candles as they appear.

August Comex Gold futures closed lower on Thursday as investors squared positions ahead of today’s U.S. Non-Farm Payrolls report at 1230 GMT. The report is not expected to be strong enough to sway the Fed nor investors sentiment about interest rates. Over the short-run, U.S. rates are expected to remain unchanged because of the uncertainty created by the UK’s vote to leave the European Union.A strong report may tell us that the U.S. economy is not headed into a recession. This may drive Treasury yields a little higher, supporting the U.S. Dollar. This would be bearish for dollar-denominated gold, but losses will be limited because of concerns over the fallout from Brexit.Technically, the main trend is up according to the daily swing chart. However, momentum could shift to the downside if the report comes out better-than-expected. A trade through $1377.50 will signal a resumption of the uptrend.The main range is $1252.80 to $1377.50. Its retracement zone at $1315.20 to $1300.40 the primary downside target.
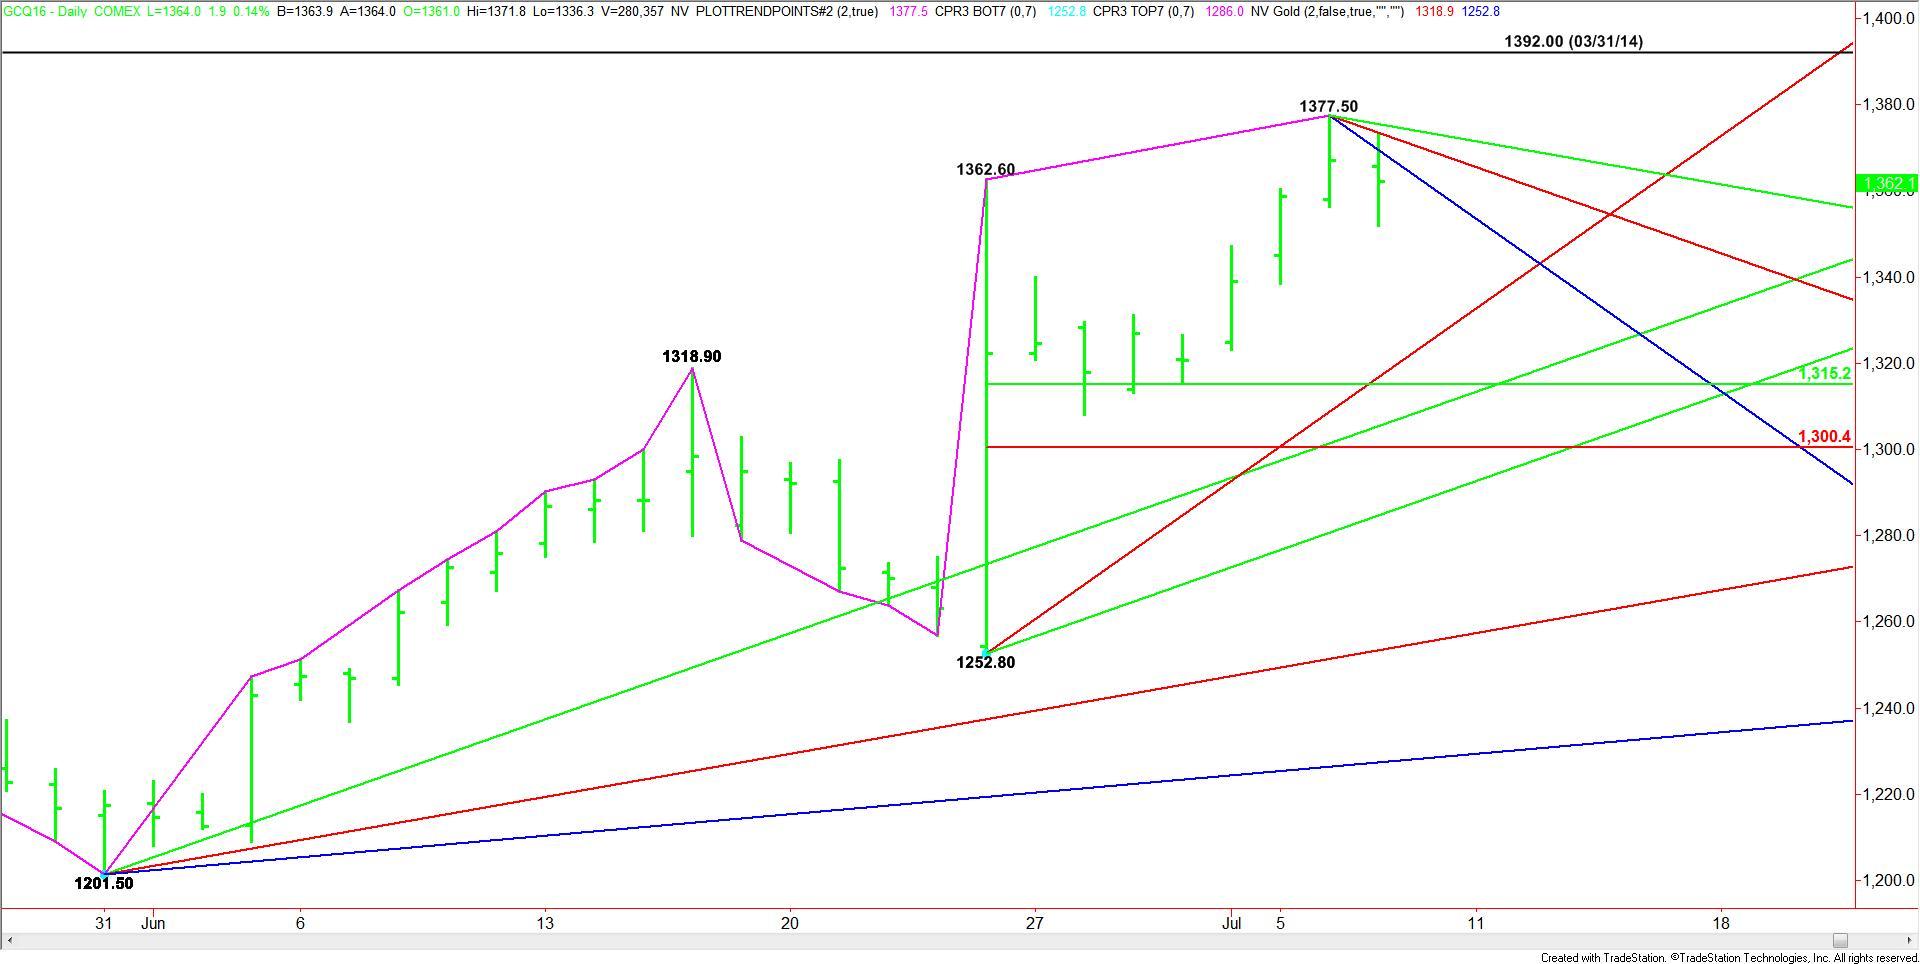
Based on yesterday’s close at $1362.10, the direction of the market today is likely to be determined by trader reaction to the downtrending angle at $1361.50.A sustained move under $1361.50 will indicate the presence of sellers. The daily chart is wide open to the downside so we could see the start of a steep break. The nearest downside target is an uptrending angle at $1316.80. This is followed closely by the short-term 50% level at $1315.20.Overtaking $1361.50 will signal the presence of buyers with the next target angles coming in at $1369.50 and $1373.50. The latter is the last potential resistance angle before the $1377.50 main top. Taking out this level could create enough upside momentum to challenge the March 31, 2014 main top at $1392.00.Watch the price action and read the order flow at $1361.50 today. Trader reaction to this angle will determine the direction of the market. From experience, I can say that we are likely to see a two-sided trade and a bigger reaction to the report next week after investors have a chance to digest the report over the week-end.
Source: FXEMPIRE
Categories :
Tags : binary options trader Comex Gold futures gold markets Gold Technical Analysis U.S. rates

