
Gold Technical Analysis – prices slipped through support on Monday below an upward sloping trend line that connects the lows in May to the lows in June and July and comes in near 1,337. Additional support on the yellow metal is now seen near the 50-day moving average at 1,310. Resistance is seen near the August highs at 1,366. Solid data in the U.S. is lifting yields and helping the dollar gain traction which is negative to the yellow metal.Momentum is negative as the MACD (moving average convergence divergence) index generated a sell signal. This occurs as the spread (the 12-day moving average minus the 26-day moving average) crosses below the 9-day moving average of the spread. The index moved from positive to negative territory confirming the sell signal. The index is printing in the red with a downward sloping trajectory which points to lower prices for the yellow metal.
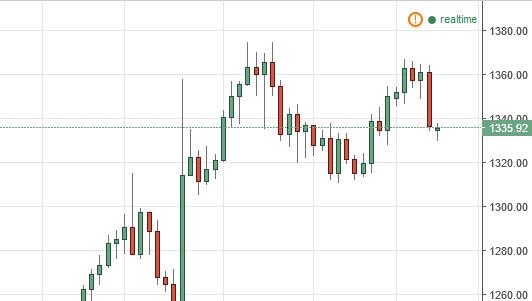
Gold Chart
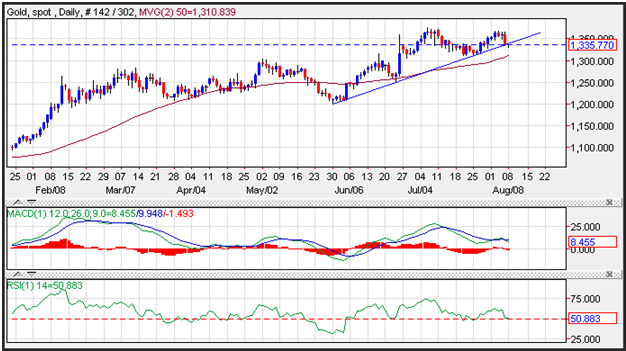
Gold prices slipped through support on Monday below an upward sloping trend line that connects the lows in May to the lows in June and July and comes in near 1,337. Additional support on the yellow metal is now seen near the 50-day moving average at 1,310. Resistance is seen near the August highs at 1,366. Solid data in the U.S. is lifting yields and helping the dollar gain traction which is negative to the yellow metal.Momentum is negative as the MACD (moving average convergence divergence) index generated a sell signal. This occurs as the spread (the 12-day moving average minus the 26-day moving average) crosses below the 9-day moving average of the spread. The index moved from positive to negative territory confirming the sell signal. The index is printing in the red with a downward sloping trajectory which points to lower prices for the yellow metal.
Source: FXEMPIRE
Categories :
Tags : Gold Chart Gold Prices Gold Technical Analysis MACD (moving average convergence divergence)

