Gold Technical Analysis(2015.11.27)

Pipsafe Logo
Share this Post :

Gold Technical Analysis(2015.11.27)

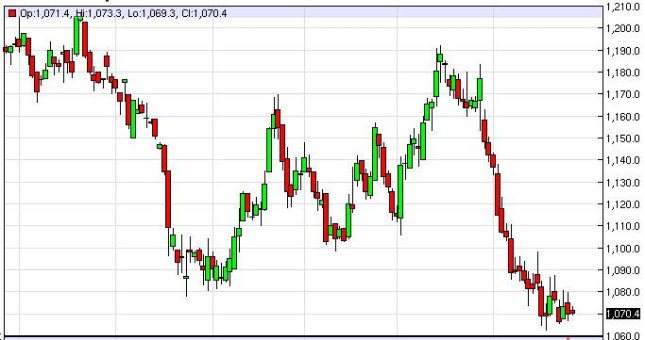
Gold markets did very little during the course of the day on Thursday, as we continue to hang about the $1070 level. With this, the market looks as if it is going to continue to grind in this general vicinity for the time being. With this being the case we are on the sidelines and simply do not have any interest in trading this market with perhaps the lone exception of selling short-term rallies that show signs of exhaustion, especially near the $1100 level. On the other hand though, if we break down to a fresh, new low, we would sell their as well.

Gold Chart

gold chart


Source:FXEMPIRE


Categories :
Tags :

user image
Reply

Gold Says

3 3

The RSI and MACD indicators are below the zero level on the H4 chart and this shows the sellers aare ready to continue falling!

user image
Reply

Obofi Says

3 3

I have a sell signal for gold from current level : Trend 1 hour: Down Target 1:083.00 .Target 2: 1059.00.

user image Reply

Forex & You! Says

3 3

i am agree! after it 1000$ and 900$ ! yes ..gold will fall to 900$per once! this is my best Forecast for next days of gold

user image
Reply

Salarof Says

3 3

If this metal fails to maintain the downward momentum, a reversal and trading higher could potentially unfold.

user image
Reply

STANDO Says

2 3

I have checked all long time frames such as monthly,weekly and daily chart and I can\'t see any valid reason and good sign to increase of the price at the moment!!!!


LEAVE A COMMENT


Alert Header

Alert Message