
[text]
Technical analysis of EUR/NZD dated 2015.01.12
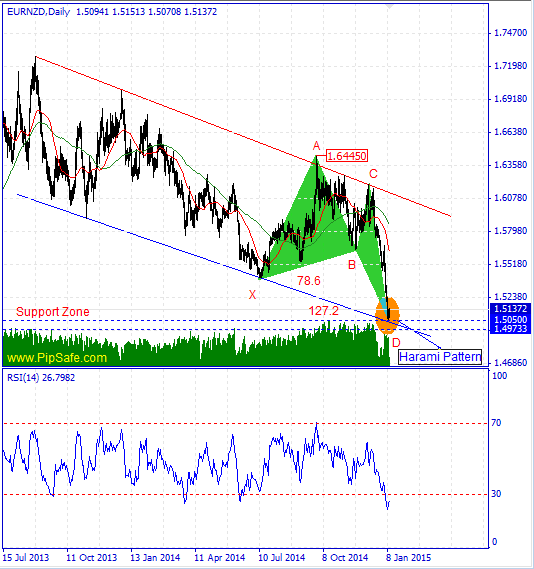
Right now EUR/NZD pair in its descending trend from 2009 year is in the lowest (around)fixed prices during its recent 15 years and Sellers have the price close to the supportive levels’ range of 2012 and 2013.Price has been stopped from more descending with reaching to the supportive edge of Down Channel pattern and also the round supportive level of 1.50500(sellers use this levels to exit their trades) and starts to ascend.
As it is obvious in the picture below, there is an ideal butterfly pattern between the top price of 1.64450 and the bottom price of 1.50500 that there is a potential for ceasing of price from D point of this pattern.RSI indicator is in saturation sell area in daily time frame and according to the next cycle confirms the mentioned bottom price(D) and warns about ascending during the next candles.Generally until the Support Level of 1.50500 on Down Channel is preserved, the price has the potential for reformation and ascends in this currency pair.
Written by the technical team of PipSafe Company
EUR/NZD Chart
[/text]
Categories :
Tags : EUR/NZD EUR/NZD News Forex Forex News Harmonic Patterns Latest EUR/NZD News Latest Forex News News RSI RSI indicator

