
[text]
Technical analysis of NZD/USD dated 28.01.2015
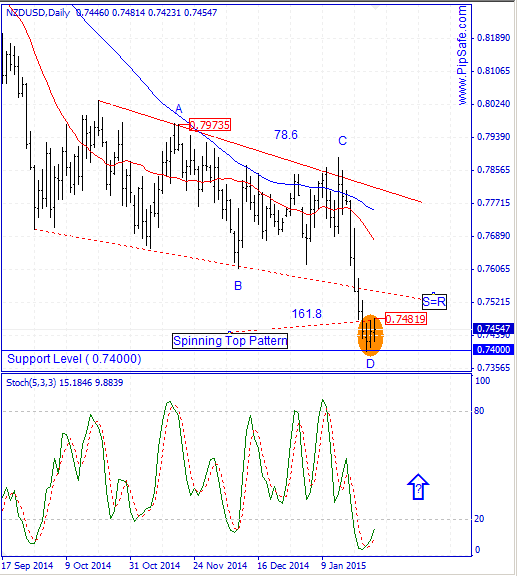
NZD/USD was in a strong and consistent downtrend during the recent Days that Sellers were successful in obtaining the lowest price of 0.74000. price with reaching to the important round level of 0.74000 has stopped from more descend( Sellers used this level to exit their trades) and with formation of a bottom price in daily time frame has prepared a field for ascending of price.
As it is obvious in the picture below, between the top price of 0.79735 and bottom price of 0.74000 there is AB=CD harmonic pattern with ratios of 78.6 and 161.8 that warns the potential of ascending from the D point of this pattern.
In Daily time frame Stoch indicator is in saturation sell area and with the next cycle confirms the bottom price of 0.74000.Right Now the first warning for ascending is breaking of the resistance level of 0.74819.
NZD/USD Chart
Written by the technical team of PipSafe Company
[/text]
Categories :
Tags : AB=CD harmonic pattern Daily time frame Forex Market Analysis NZD/USD Chart Stoch indicator

