The NYSE Tick Index And Candlesticks
A wealth of information waits to be discovered in the New York Stock Exchange (NYSE) tick index. Its strong
suit is its simple calculation. At any point, this index represents the number of stocks trading on an uptick minus the
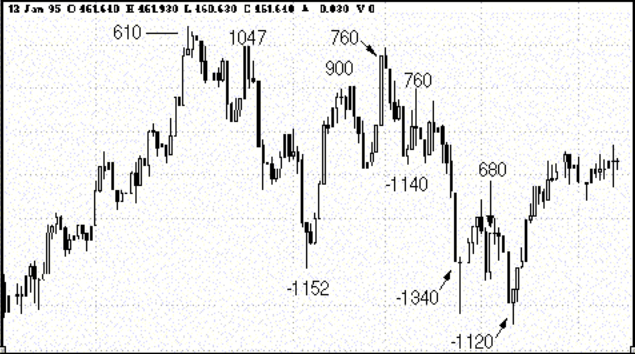
number of stocks trading on a down tick. Extreme tick readings of greater than +600 may indicate temporary
exhaustion of buying power, while negative tick readings in the territory of 800 or more can point to a selling climax.
I use these readings throughout the day as an indicator for buy and sell decisions, as well as for recognizing the
continuation of the prevailing trend. The tick index is broadcast throughout the day from most real-time data vendors,including the stock market tape that can be seen on the bottom of the screen during CNBC’s day-time broadcast.The tick index can be enhanced by using technical price pattern recognition, specifically candlestick charts. (See sidebar, “The candlestick method.”) Although I have used numerous other technical studies, combining the NYSE tick index and candlestick charting creates a reliable indicator for signaling turning points in the stock market.
To read More ,please download the book.
forex bonus without deposit, Forex Broker, forex broker bonus, forex learn, forex learning, forex learning pdf, forex tutorials for beginners pdf, how to trade forex for beginners pdf, learning forex trading pdf
Similar Videos and E-books


LEAVE A COMMENT
All Books
For Beginners
- Candlesticks For Support And Resistance
- Online Trading Courses
- Commodity Futures Trading for Beginners
- Hidden Divergence
- Peaks and Troughs
- Reverse Divergences And Momentum
- Strategy:10
- The NYSE Tick Index And Candlesticks
- Trend Determination
- The Original Turtle Trading Rules
- Introduction to Forex
- The Six Forces of Forex
- Study Book for Successful Foreign Exchange Dealing
- Forex. On-Line Manual for Successful Trading
- 18 Trading Champions Share Their Keys to Top Trading Profits
- The Way to Trade Forex
- The Truth About Fibonacci Trading
- Quick Guide to Forex Trading
- Chart Patterns and Technical Indicators
- Forex Trading
- Trading Forex: What Investors Need to Know
- My Dog Ate My Forex
- Point & Figure for Forex
Forex Market in General
- Screen Information, Trader Activity, and Bid-Ask Spreads in a Limit Order Market
- Strategic experimentation in a dealership market
- Limit Orders, Depth, and Volatility
- Reminiscences of a Stock Operator
- Market Profile Basics
- Quote Setting and Price Formation in an Order Driven Market
- Phantom of the Pits
- An Introduction to Market Profile and a Users Guide to Capital Flow Software
- The Effect of Tick Size on Volatility, Trader Behavior, and Market Quality
- Trading as a Business
- What Moves the Currency Market?
- Macroeconomic Implications of the Beliefs and Behavior of Foreign Exchange Traders
- All About the Foreign Exchange Market in the United States
Psychology of Trading
- A Course in Miracles
- Thoughts on Trading
- Calming The Mind So That Body Can Perform
- Lifestyles of the Rich and Pipped
- The Miracle of Discipline
- Zoom in on Personal Trading Behavior And Profit from It
- The Woodchuck and the Possum
- 25 Rules Of Forex Trading Discipline
- Stop Losses Are For Sissies
- Your Personality and Successful Trading
- Trading as a Business
- The 7 Deadly Sins of Forex (and How to Avoid Them)
- The 5 Steps to Becoming a Trader
Money Management
- Risk Control and Money Management
- Money Management
- Position-sizing Effects on Trader Performance: An experimental analysis
- Fine-Tuning Your Money Management System
- Money Management: Controlling Risk and Capturing Profits
- Money Management Strategies for Serious Traders
- The Truth About Money Management
- Money Management and Risk Management
Forex Strategy
- 1-2-3 System
- Bollinger Bandit Trading Strategy
- Value Area
- The Dynamic Breakout II Strategy
- Ghost Trader Trading Strategy
- King Keltner Trading Strategy
- Scalp Trading Methods
- LSS - An Introduction to the 3-Day Cycle Method
- Market Turns And Continuation Moves With The Tick Index
- The Money Manager Trading Strategy
- Picking Tops And Bottoms With The Tick Index
- The Super Combo Day Trading Strategy
- The Eleven Elliott Wave Patterns
- The Thermostat Trading Strategy
- Intraday trading with the TICK
- Traders Trick Entry
- Fibonacci Trader Journal
- Rapid Forex
- Microtrading the 1 Minute Chart
- BunnyGirl Forex Trading Strategy Rules and FAQ
- The Daily Fozzy Method
- Forex Traders Cheat Sheet
- Offset Trading
- How to Trade Both Trend and Range Markets by Single Strategy?
- A Practical Guide to Technical Indicators; Moving Averages
- FX Wizard
- FX Destroyer
- A Practical Guide to Swing Trading
- Practical Fibonacci Methods for Forex Trading
- Using The Heikin-Ashi Technique
- The Day Trade Forex System
- 5/13/62
- Not So Squeezy Trading Manual
- KobasFX Strategy
- Killer Patterns
- 3D Trading
- 4 Hour MACD Forex Strategy
- WRB Analysis Tutorial
Advanced Forex Trading
- A New Interpretation of Information Rate
- CCI Manual
- Nicktrader and Jeff Explaining Reverse and Regular Divers
- NickTrader on No Price CCI Divergence Trading
- Are Supply and Demand Driving Stock Prices?
- The Sharpe Ratio
- The Interaction Between the Frequency of Market Quotes, Spread and Volatility in Forex
- Trend Determination
- Trend vs. No Trend
- A Six-Part Study Guide to Market Profile
- How George Soros Knows What He Knows
- Core Point and Figure Chart Patterns
- Coders Guru Full Course
- Point and Figure Charting: a Computational Methodology and Trading Rule Performance in the S&P 500 Futures Market
- Evolving Chart Pattern Sensitive Neural Network Based Forex Trading Agents
- Heisenberg Uncertainty Principle and Economic Analogues of Basic Physical Quantities
- The String Prediction Models as an Invariants of Time Series in Forex Market
- Using Recurrent Neural Networks to Forecasting of Forex
- The New Elliott Wave Rule - Achieve Definitive Wave Counts

