[text]
Technical Analysis of USD/RUB Dates 2014.12.03
Written by the technical team of PipSafe Company
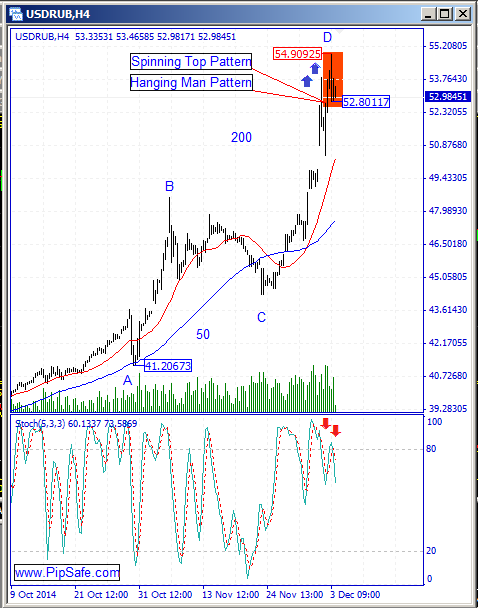
USD/RUB was in a strong and consistent uptrend during the recent months that buyers were successful in achieving the highest price of 54.90925.Right now in long term time frames such as monthly ,weekly and daily there is not any clear reason for increasing of the price and price with being above 5-day moving average in monthly, weekly and daily time frames warns about increasing of price during the next candles.According to the formed price movements in the chart, between the bottom price of 41.206726 and top price of 54.909252 ,there is AB=CD harmonic pattern with ideal ratios of 50 and 200 that with completion of the D point there will be a warning for descending of price.
Stoch indicator is in saturation buy area and in divergence mode with the price chart confirms the mentioned top price and warns about changing price direction.In the range of the D point, there are Hanging Man and spinning top candlestick pattern which is not a good sign for the buyers that there is the possibility for formation of a top price.Please note that Currently There is no clear and important sign(in daily and weekly TF) for descending of the price and the least sign for price reformation and increasing of the price is formation of a top price in daily time frame.
[/text]
Categories :
Tags : AB=CD Pattern Forex Analysis Hanging Man USD/RUB Technical Anlaysis

