
[text]
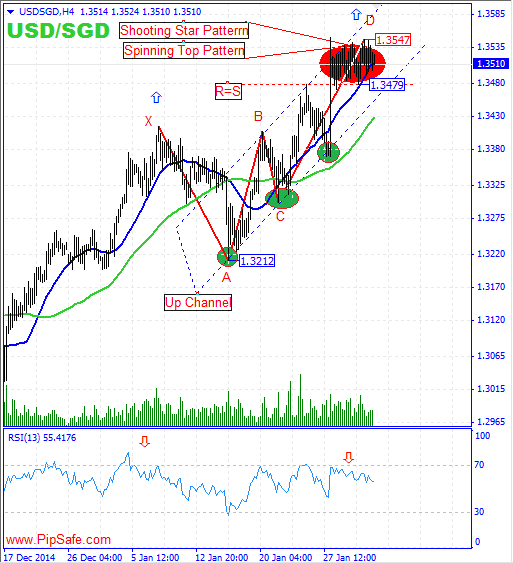
USD/SGD since 23.07.2014 was in strong and consistent uptrend with small price reformations. Buyers during this uptrend were successful in achieving the highest price of 1.3547.currently the price in Monthly , weekly and daily time frame is above 5-day moving average and warns the potential of ascending in long period of time in this currency pair.
According to the type of formed candles like Spinning Top Pattern and Shooting Star candlestick patterns in red color area(also Hanging Man in Daily Time Frame) warns about Vulnerability of uptrend and formation of a top price and decreasing of the price.As it is obvious in the picture below, there is ideal deep Crab harmonic pattern between the top price of 1.3547 and the bottom price of 1.3212 that there is a potential for ceasing of price from D point of this pattern.
According to the formed price movements, RSI indicator is in saturation buy area and in divergence mode with the price chart that confirms the top price of 1.3547 and warns about changing price direction.One of the important signs for descending is breaking of ascending trend line (made of 3 bottom prices). Generally according to the current situation in 4H time frame until the top price of 1.3547 is preserved, price will have the potential of descending but according to the potential of ascending in long period of time, the descending of price is temporary and unstable.
Written by the technical team of PipSafe Company
USD/SGD Chart
[/text]
Categories :
Tags : Analysis deep crab harmonic pattern Forex Hanging Man Shooting Star USD/SGD USD/SGD Chart

