Using The Heikin Ashi Technique – Since the introduction of the candlestick method to the US some two decades ago, it caused a revolution in perceiving how the bullish and bearish forces perform in the Western markets. It has become a popular charting tool, as traders have used candlesticks to make chart formations easier to spot and name. But interpreting candlesticks can be challenging. To make things easier, the heikin-ashi technique modifies the traditional candlestick chart. Let’s take a look at how it works.
BALANCING ON ONE FOOT The heikin-ashi method {heikin means “average” or “balance” in Japanese, while ashi means “foot” or “bar”) is a visual technique that eliminates irregularities from a normal chart, offering a better picture of trends and consolidations. Just by looking at a candlestick chart created with this method, you get a good idea of the market’s status and its strength. Take a look at the candlestick chart of Canon ADR in Figure 1A versus the heikin-ashi modified chart in Figure 1B. Which chart would you prefer to use? CALCULATION The heikin-ashi candlestick technique uses modified open-high-low-close (OHLC) values and displays them as candlesticks. The modified values are computed using these definitions:
haClose = (O+H+L+C)/4 •
haOpen = (haOpen (previous bar) + haClose (previous bar))/2 •
haHigh = Maximum(H, haOpen, haClose) •
haLow = Minimum(L, haOpen, haClose)
The “open,” “high,” “low,” and “close” referred to are of the current bar. The prefix ha- indicates the corresponding heikin-ashi modified values. I have used daily data throughout this article, so one bar represents one trading day. Depending on the trading time frame, you may employ other data, such as intraday, weekly, or monthly.
The value haOpen is always set to the midpoint of the body of the previous bar, while haClose is computed as the average price of the current bar. The modified high, haHigh, is chosen as the highest value of the set {real high (H), modified open (haOpen), and modified close (haClose)}. The same logic applies to the definition of the modified low: It is the lowest value in the set {real low (L), modified open (haOpen), and modified close (haClose)}. The first sidebar, “Heikin-Ashi OHLC Values,” details how to compute heikin-ashi values using Excel.
APPLYING IT Looking at charts is the best way to understand the main features of the heikin-ashi technique. If the haClose is above haOpen, then a bullish sign occurs (white candle). If haClose is below haOpen, then a bearish sign appears (black candle).
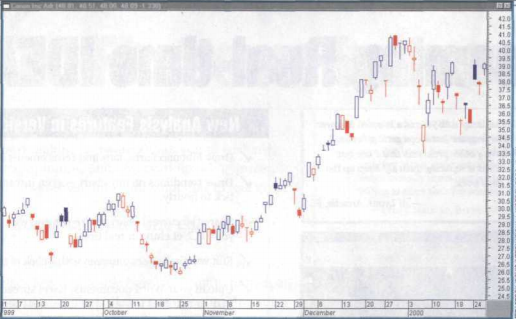
FIGURE 1 A: DAILY CHART OF CANON. This is the traditional candlestick chart of Canon.
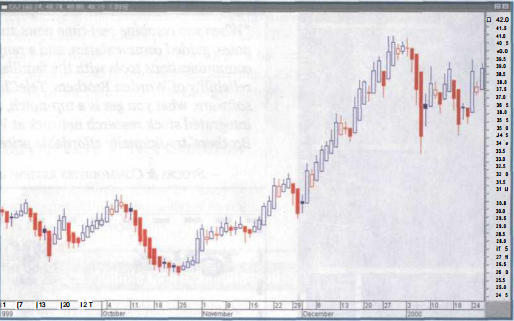
FIGURE IB: DAILY MODIFIED CHART OF CANON. The heikin-ashi technique works as a filter, eliminating irregularities and making the chart smoother with well-defined trends.
At first glance, Figure 1 shows that the heikin-ashi chart looks more compact and smooth compared to the traditional chart. White candles display a rising trend, while black candles indicate a downtrend. Gaps, which occur frequently on the traditional OHLC chart, are not present because they are incorporated into the modified candles. Strong positive trends have long white bodies with no lower shadows, while strong negative trends have long black bodies with no upper shadows. When bodies become shorter, a weaker trend is anticipated (see mid-October and end of December). In the beginning of November, Canon weakened its uptrend and started a consolidation period with several small bodies with both long upper and lower shadows.
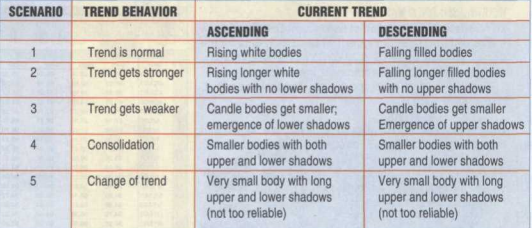
A very small body with tall shadows on the first trading day in 2000 warned about a possible change of the rising trend. As consolidations contain several bodies with tall shadows, it is not safe to assume that the presence of a small body with tall shadows will indicate a change in trend. Figure 2 summarizes the five scenarios that can be identified on a heikin-ashi candle chart. EXAMPLES To give you an idea of how to apply the heikin-ashi charting technique, I will show you three examples using the Standard & Poor’s 500 index (SP500-HA), the price of gold (XGLDHA), and Pfizer (PFE-HA).
The heikin-ashi OHLC values were calculated as indicated in the sidebar and plotted. Each chart contains two candlestick subcharts: The top contains the modified OHLC values, while the bottom has the real values. Each number in the table in Figure 2 (1 to 5) applies to the chart whenever a relevant scenario appears. They are labeled in different colors to differentiate descending and ascending trends. For each chart I’ll discuss how this technique can be used to either enter and stay on the right side of the trend, or avoid trading during periods of consolidations.
Standard & Poor’s 500 (SP500-HA): Figure 3 offers no doubt about the usefulness of this method, even for a novice: All trends are visible, with short consolidations marked as (4) occurring in February and July. Strong rising trends (2) were marked by long white candle bodies with no lower shadows, while strong falling trends (2) were accompanied by filled candle bodies with no upper shadows.
Using the observations in Figure 2, note how the smaller bodies (3) in January 2003 warned about a weakening of the trend, and subsequently, a reversal (4). Trend changes (5) were pointed out by small bodies with longer shadows, but as an exception, the reversal in March occurred without any such sign. Although a rising trend, the segment AB was composed of several short sections (normal trend, weakening, consolidation). It could also be seen as a normal ascending trend (1) due to a majority of white bodies.
The heikin-ashi is a visual technique that eliminates irregularities from a normal chart, offering a better picture of trends and consolidations.
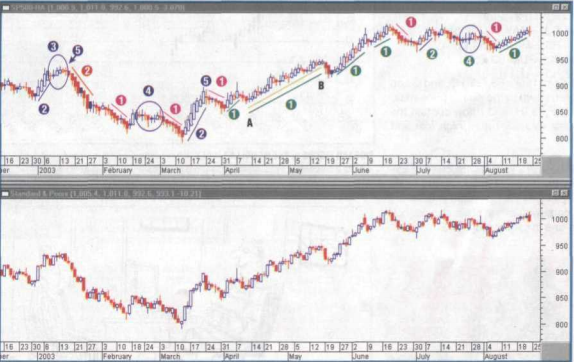
FIGURE 3: S&P 500 MODIFIED. All trends are well-defined by sequences of white or red bodies, making them easy to identify and follow.
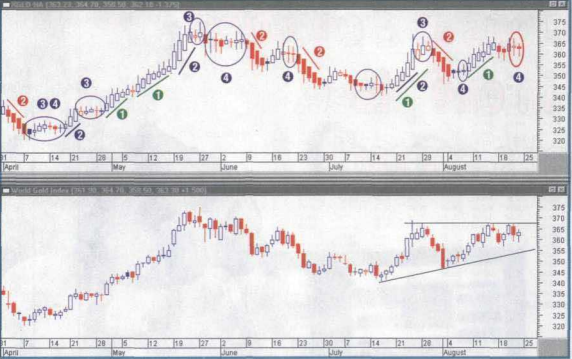
FIGURE 4: MODIFIED CHART OF GOLD PRICES. White bodies dominate in rising trends. Pullbacks are short and strong, marked by longer red bodies.
Gold (XGLD-HA): – 37.0 – 36.5 – 360 – 35.5 – 35.0 – 34.5 – 34.0 j – 33.5 г 33.0 г 32.5 h 32.0 – 31.5 – 31.0 – 30.5 30.0 29.5 29.0 FIGURE 5: MODIFIED CHART OF PFIZER. In an uptrend or downtrend, Pfizer displays several small consolidation periods marked by the presence of small bodies with upper and lower shadows. 24 • February 2004 • Technical Analysis of STOCKS & COMMODITIES Another example of the simplicity gained by using modified heikin-ashi values is in the chart of gold prices in Figure 4. A longer rising trend (April-May) was dominated by white candles (1) and (2) with a small consolidation (4) toward the end of April.
The very small body in May was just a pause before the next leg up; most of the candles were white bodies with no lower shadows. The smaller bodies toward the end of May announced either a weakening of the trend (3) or the start of a consolidation period (4). The consolidation in May-June was well defined (small bodies with both long upper and lower shadows). In August, there was another consolidation (4). Given the presence of an ascending triangle, there was a very good chance that price would break out of this short consolidation.
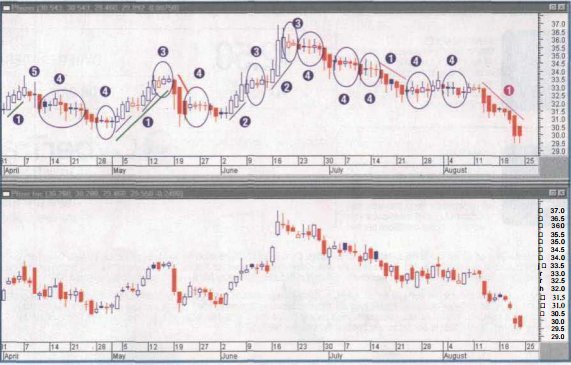
Pfizer (PFE-HA): If you have been trading Pfizer (PFE), you should be familiar with its behavior, which is highlighted in both charts in Figure 5: many small consolidations on the way both up and down. Gaps are not shown on the modified chart, which makes it easier to read. The small body with long upper and lower shadows (5) confirms a change of trend in April. As shown on the daily chart, the longer trends are not continuous (as in the previous examples), but interrupted by small consolidations.
In this case, it would be worthwhile to analyze weekly charts. HEIKIN-ASHI AND SIMPLE INDICATORS From a visual standpoint, the heikin-ashi technique is based on the effect of the size and color of the candle bodies. For additional confirmation, many traders use indicators, so to make life easier I defined two simple indicators: haOpen and haClose. I applied these to the chart of Ultimate Software Group (ULTI). See the second sidebar, “Defining Simple Indicators Based On Modified OHLC Values,” for details on these indicators. You can see them in a separate window in.
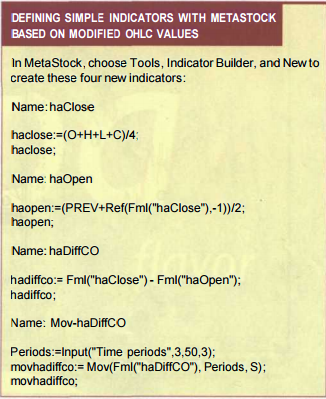
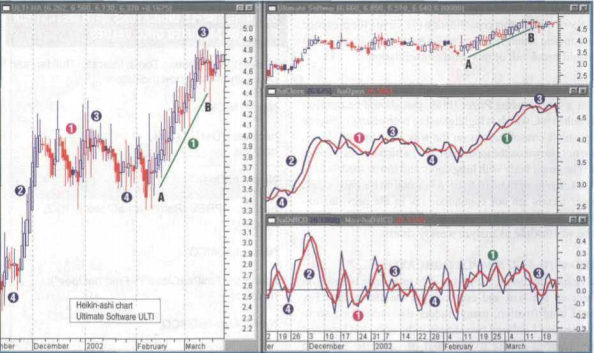
Figure 6. In these indicators, long bodies correspond to large differences between the modified close and open (2). Small bodies (3) represent these two indicators getting closer, and mean either the start of a consolidation (4) or a possible change of trend. Between February and March 2002 (trend AB), the stock was in an uptrend, but the modified chart ULTI-HA records this as a series of white candles with both lower and upper shadows (4). This is an exception. I created another simple indicator, haDiffCO, which is displayed in a separate subchart.
Positive values correspond to white bodies (ascending trends), while negative values indi cate downtrends. In addition, you can apply a shorter moving average (Mov-haDiffCo) to this indicator, and observe that: • Crossings will point, with good accuracy, to changes in the trend. Unfortunately, the whipsaws may eliminate some good trades. • Positive values of Mov-haDiffCo indicate an uptrend, while Mov-haDiffCo values below zero show a downtrend. Both of these indicators are also discussed in the sidebar.
Another interesting feature is the anticipation of a change in the strength of the next trading bar. Assume you are at the end of today’ s trading session. Based on the calculation of haOpen:
haOpen (tomorrow) = (haOpen(today) + haClose(today))/2 (A)
The position of haClose(tomorrow)versus haOpen(tomorrow)
will determine the color of the candle body:
If haClose(tomorrow) > haOpen(tomorrow) Else Body (tomorrow) = white Body
(tomorrow) = filled/red (B) Endif
SUMMARY
The heikin-ashi charting technique is a visual, less subjective method for displaying trending and consolidation periods. The color of the modified candlesticks indicates the nature of the trend: A series of white bodies shows an ascending trend, while a sequence of black candle bodies is associated with a downtrend.
The size of the candlestick body indicates the strength of the current trend: Long white bodies show a strong ascending trend and long black bodies are associated with stronger downtrends. In an ascending trend, the emergence of the lower shadow suggests weakening, although an exception was highlighted in Figure 6. In a falling trend, the presence of upper shadows suggests weakening.
Periods of consolidation are characterized by a sequence of smaller white and black bodies with longer upper and lower shadows. In some cases, the emergence of a candle with a small body and long shadows suggests an imminent change of trend (for an exception, see the reversal in March 2003, Figure 3). If the visual element is not sufficient, simple indicators can be used to arrive at similar conclusions.
The main advantage of this simple method is a better visual perspective of the current status and strength of the trend or consolidation, and a possible anticipation of the next bar’s strength. As with any other charting method, the heikin-ashi is not 100% reliable and therefore should be combined with other technical indicators. Your trading, of course, should also include risk- and capital-control strategies. Dan Valcu is a Swedish private trader, computer consultant, and a technical analysis instructor. He may be reached at [email protected]. With special thanks to S. Koike.
by Dan Valcu
binary options trader, Forex Education Books, Heikin Ashi, heikin-ashi charting technique, heikin-ashi OHLC, Using The Heikin Ashi Technique Download, Using The Heikin Ashi Technique ebook
Similar Videos and E-books


LEAVE A COMMENT
All Books
For Beginners
- Candlesticks For Support And Resistance
- Online Trading Courses
- Commodity Futures Trading for Beginners
- Hidden Divergence
- Peaks and Troughs
- Reverse Divergences And Momentum
- Strategy:10
- The NYSE Tick Index And Candlesticks
- Trend Determination
- The Original Turtle Trading Rules
- Introduction to Forex
- The Six Forces of Forex
- Study Book for Successful Foreign Exchange Dealing
- Forex. On-Line Manual for Successful Trading
- 18 Trading Champions Share Their Keys to Top Trading Profits
- The Way to Trade Forex
- The Truth About Fibonacci Trading
- Quick Guide to Forex Trading
- Chart Patterns and Technical Indicators
- Forex Trading
- Trading Forex: What Investors Need to Know
- My Dog Ate My Forex
- Point & Figure for Forex
Forex Market in General
- Screen Information, Trader Activity, and Bid-Ask Spreads in a Limit Order Market
- Strategic experimentation in a dealership market
- Limit Orders, Depth, and Volatility
- Reminiscences of a Stock Operator
- Market Profile Basics
- Quote Setting and Price Formation in an Order Driven Market
- Phantom of the Pits
- An Introduction to Market Profile and a Users Guide to Capital Flow Software
- The Effect of Tick Size on Volatility, Trader Behavior, and Market Quality
- Trading as a Business
- What Moves the Currency Market?
- Macroeconomic Implications of the Beliefs and Behavior of Foreign Exchange Traders
- All About the Foreign Exchange Market in the United States
Psychology of Trading
- A Course in Miracles
- Thoughts on Trading
- Calming The Mind So That Body Can Perform
- Lifestyles of the Rich and Pipped
- The Miracle of Discipline
- Zoom in on Personal Trading Behavior And Profit from It
- The Woodchuck and the Possum
- 25 Rules Of Forex Trading Discipline
- Stop Losses Are For Sissies
- Your Personality and Successful Trading
- Trading as a Business
- The 7 Deadly Sins of Forex (and How to Avoid Them)
- The 5 Steps to Becoming a Trader
Money Management
- Risk Control and Money Management
- Money Management
- Position-sizing Effects on Trader Performance: An experimental analysis
- Fine-Tuning Your Money Management System
- Money Management: Controlling Risk and Capturing Profits
- Money Management Strategies for Serious Traders
- The Truth About Money Management
- Money Management and Risk Management
Forex Strategy
- 1-2-3 System
- Bollinger Bandit Trading Strategy
- Value Area
- The Dynamic Breakout II Strategy
- Ghost Trader Trading Strategy
- King Keltner Trading Strategy
- Scalp Trading Methods
- LSS - An Introduction to the 3-Day Cycle Method
- Market Turns And Continuation Moves With The Tick Index
- The Money Manager Trading Strategy
- Picking Tops And Bottoms With The Tick Index
- The Super Combo Day Trading Strategy
- The Eleven Elliott Wave Patterns
- The Thermostat Trading Strategy
- Intraday trading with the TICK
- Traders Trick Entry
- Fibonacci Trader Journal
- Rapid Forex
- Microtrading the 1 Minute Chart
- BunnyGirl Forex Trading Strategy Rules and FAQ
- The Daily Fozzy Method
- Forex Traders Cheat Sheet
- Offset Trading
- How to Trade Both Trend and Range Markets by Single Strategy?
- A Practical Guide to Technical Indicators; Moving Averages
- FX Wizard
- FX Destroyer
- A Practical Guide to Swing Trading
- Practical Fibonacci Methods for Forex Trading
- Using The Heikin-Ashi Technique
- The Day Trade Forex System
- 5/13/62
- Not So Squeezy Trading Manual
- KobasFX Strategy
- Killer Patterns
- 3D Trading
- 4 Hour MACD Forex Strategy
- WRB Analysis Tutorial
Advanced Forex Trading
- A New Interpretation of Information Rate
- CCI Manual
- Nicktrader and Jeff Explaining Reverse and Regular Divers
- NickTrader on No Price CCI Divergence Trading
- Are Supply and Demand Driving Stock Prices?
- The Sharpe Ratio
- The Interaction Between the Frequency of Market Quotes, Spread and Volatility in Forex
- Trend Determination
- Trend vs. No Trend
- A Six-Part Study Guide to Market Profile
- How George Soros Knows What He Knows
- Core Point and Figure Chart Patterns
- Coders Guru Full Course
- Point and Figure Charting: a Computational Methodology and Trading Rule Performance in the S&P 500 Futures Market
- Evolving Chart Pattern Sensitive Neural Network Based Forex Trading Agents
- Heisenberg Uncertainty Principle and Economic Analogues of Basic Physical Quantities
- The String Prediction Models as an Invariants of Time Series in Forex Market
- Using Recurrent Neural Networks to Forecasting of Forex
- The New Elliott Wave Rule - Achieve Definitive Wave Counts

