Bollinger Bandit Trading Strategy
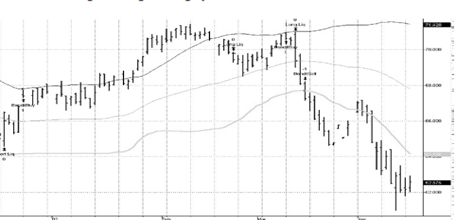
Standard deviation is a number that indicates how much on average each of the values in the distribution deviates from the mean (or center) of the distribution. Bollinger Bands, created by John Bollinger in the 1960s, is an indicator that uses this statistical measure to determine support and resistance levels. This indicator consists of three lines and is very simple to derive; the middle line is a simple moving average of the underlying price data and the two outside bands are equal to the moving average plus or minus one standard deviation. Based on theory, two standard deviations equates to a 95 percent confidence level. In other words, 95 percent of the time the values used in our sampling fell within two standard deviations of the average. Initially, Bollinger Bands were used to determine
the boundaries of market movements.
If a market moved to the upper band or lower band, then there was a good chance that the market would move back to its average. We have carried out numerous tests on this hypothesis and seemed to always come back with failure. Instead of using the upper band as a resistance point, we discovered, as others have, that it worked much better as a breakout indicator. The same goes for the lower band. The Bollinger Bandit uses one standard deviation above the 50-day moving average as a potential long entry and one standard deviation below the 50-day moving average as a potential short entry. This system is a first cousin of King Keltner. They are similar in that they are longer-term channel breakout systems. However, this is where the similarities end. Instead of simply liquidating a position when the market moved back to the moving average, we concocted a little twist to this exit technique.
From observing the trades on the King Keltner, we discovered that we gave back a good portion of the larger profits waiting to exit the market at the moving average. So, for the Bollinger Bandit, we incorporated a more aggressive
trailing stop mechanism. When a position is initiated, the protective stop is set at the 50-day moving average. Every day that we are in a position,we decrement the number of days for our moving average calculation by one.
The longer that we are in a trade, the easier it is to exit the market with a profit.
We keep decrementing the number of days in our moving average calculation until we reach ten. From that point on, we do not decrement. There is one more element to our exit technique: the moving average must be below the
upper band if we are long and above the lower band if we are short. We added this element to prevent the system from going back into the same trade that we just liquidated. If we hadn’t used this additional condition and we were long and the moving average was above the upper band, the long entry criteria would still be set up and a long trade would be initiated.
To read More,Please download The book.
Similar Videos and E-books


LEAVE A COMMENT
All Books
For Beginners
- Candlesticks For Support And Resistance
- Online Trading Courses
- Commodity Futures Trading for Beginners
- Hidden Divergence
- Peaks and Troughs
- Reverse Divergences And Momentum
- Strategy:10
- The NYSE Tick Index And Candlesticks
- Trend Determination
- The Original Turtle Trading Rules
- Introduction to Forex
- The Six Forces of Forex
- Study Book for Successful Foreign Exchange Dealing
- Forex. On-Line Manual for Successful Trading
- 18 Trading Champions Share Their Keys to Top Trading Profits
- The Way to Trade Forex
- The Truth About Fibonacci Trading
- Quick Guide to Forex Trading
- Chart Patterns and Technical Indicators
- Forex Trading
- Trading Forex: What Investors Need to Know
- My Dog Ate My Forex
- Point & Figure for Forex
Forex Market in General
- Screen Information, Trader Activity, and Bid-Ask Spreads in a Limit Order Market
- Strategic experimentation in a dealership market
- Limit Orders, Depth, and Volatility
- Reminiscences of a Stock Operator
- Market Profile Basics
- Quote Setting and Price Formation in an Order Driven Market
- Phantom of the Pits
- An Introduction to Market Profile and a Users Guide to Capital Flow Software
- The Effect of Tick Size on Volatility, Trader Behavior, and Market Quality
- Trading as a Business
- What Moves the Currency Market?
- Macroeconomic Implications of the Beliefs and Behavior of Foreign Exchange Traders
- All About the Foreign Exchange Market in the United States
Psychology of Trading
- A Course in Miracles
- Thoughts on Trading
- Calming The Mind So That Body Can Perform
- Lifestyles of the Rich and Pipped
- The Miracle of Discipline
- Zoom in on Personal Trading Behavior And Profit from It
- The Woodchuck and the Possum
- 25 Rules Of Forex Trading Discipline
- Stop Losses Are For Sissies
- Your Personality and Successful Trading
- Trading as a Business
- The 7 Deadly Sins of Forex (and How to Avoid Them)
- The 5 Steps to Becoming a Trader
Money Management
- Risk Control and Money Management
- Money Management
- Position-sizing Effects on Trader Performance: An experimental analysis
- Fine-Tuning Your Money Management System
- Money Management: Controlling Risk and Capturing Profits
- Money Management Strategies for Serious Traders
- The Truth About Money Management
- Money Management and Risk Management
Forex Strategy
- 1-2-3 System
- Bollinger Bandit Trading Strategy
- Value Area
- The Dynamic Breakout II Strategy
- Ghost Trader Trading Strategy
- King Keltner Trading Strategy
- Scalp Trading Methods
- LSS - An Introduction to the 3-Day Cycle Method
- Market Turns And Continuation Moves With The Tick Index
- The Money Manager Trading Strategy
- Picking Tops And Bottoms With The Tick Index
- The Super Combo Day Trading Strategy
- The Eleven Elliott Wave Patterns
- The Thermostat Trading Strategy
- Intraday trading with the TICK
- Traders Trick Entry
- Fibonacci Trader Journal
- Rapid Forex
- Microtrading the 1 Minute Chart
- BunnyGirl Forex Trading Strategy Rules and FAQ
- The Daily Fozzy Method
- Forex Traders Cheat Sheet
- Offset Trading
- How to Trade Both Trend and Range Markets by Single Strategy?
- A Practical Guide to Technical Indicators; Moving Averages
- FX Wizard
- FX Destroyer
- A Practical Guide to Swing Trading
- Practical Fibonacci Methods for Forex Trading
- Using The Heikin-Ashi Technique
- The Day Trade Forex System
- 5/13/62
- Not So Squeezy Trading Manual
- KobasFX Strategy
- Killer Patterns
- 3D Trading
- 4 Hour MACD Forex Strategy
- WRB Analysis Tutorial
Advanced Forex Trading
- A New Interpretation of Information Rate
- CCI Manual
- Nicktrader and Jeff Explaining Reverse and Regular Divers
- NickTrader on No Price CCI Divergence Trading
- Are Supply and Demand Driving Stock Prices?
- The Sharpe Ratio
- The Interaction Between the Frequency of Market Quotes, Spread and Volatility in Forex
- Trend Determination
- Trend vs. No Trend
- A Six-Part Study Guide to Market Profile
- How George Soros Knows What He Knows
- Core Point and Figure Chart Patterns
- Coders Guru Full Course
- Point and Figure Charting: a Computational Methodology and Trading Rule Performance in the S&P 500 Futures Market
- Evolving Chart Pattern Sensitive Neural Network Based Forex Trading Agents
- Heisenberg Uncertainty Principle and Economic Analogues of Basic Physical Quantities
- The String Prediction Models as an Invariants of Time Series in Forex Market
- Using Recurrent Neural Networks to Forecasting of Forex
- The New Elliott Wave Rule - Achieve Definitive Wave Counts

