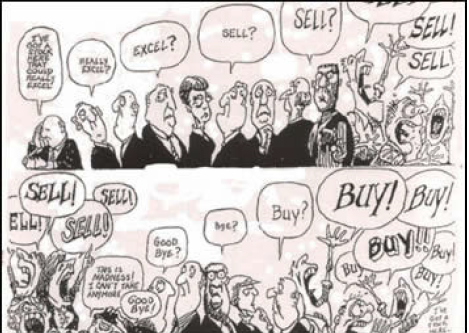
Bollinger Squeeze indicator – The markets are not a gathering of lines and arrows, it is a gathering of emotional people feeding of each other. Let’s look at discovering the emotion of the markets.
Before I get into what I do to try to take advantage of the insight into market timing that the Bollinger Squeeze indicator can provide, first I thought it best to explain where this system came from in the first place.
When first trading the Forex markets, I did so with very little indicators, as, not coming from a mathematical, economical or trading background, the different coloured lines, histograms and arrows meant very little to me. I spent the first six months trading, what I learnt later was to be called, “naked”, i.e. without indicators. During these first six months I was at times disheartened, discouraging and disillusioned as I had nothing to put the blame on, no
indicator to tweak thinking it was it’s fault, but in hindsight it was the best thing I could have done to get started on the right foot.
What this did, was made sure, that I added indicators to aid me in identifying the different components of the market
that I was trying to interpret through price action alone, rather than add indicators for the sake of adding indicators.
Each indicator in this system is there to help to quickly identify a market component in an easy, visually pleasing
way. I make no apologies for the fact the charts that come with this system, are colourful and elaborate, they are this
way to make it easy on the eye, and more inviting for the brain to process.
The Market Is Alive
Anyone who has watched Big Brother, one, has little taste in television :), and two, will understand what it feels like to be on the outside looking in. The charts we look at every day is essentially a small window into the large universe that is the economic market place.To view a chart as just a series of lines and colours is to not recognize what underlies all the marketplaces in the world is one thing, people.
From shopping markets to economic markets, it is still the same thing, people exchanging one item they have for
another item another person has. Without this, a marketplace does not exist.Anyone who is in a relationship will understand that a person can be an emotional being; fear, anger, elation, depression,sadness, they are all what make us uniquely us. It is because of this that I view reading emotion to be a vital component of trading successfully. If you can get a sense of the emotion of the market, then you can devise an appropriate trading strategy to take advantage of that emotion.
There is no better time to ask my wife to watch a football game than when I can read that she is happy, predictable
and calm. I take the same techniques I use to read my wife’s mood into the marketplace, if my system is going to hold it’s own, it needs to be able to tell me what the market mood is, what it’s excitement level is, and what it is thinking.
So with this on board, there are three things I look at to determine the mood of the market; Trend, Acceleration and
Volatility. Let’s look at these one at a time.Market Mood: Trending or Ranging If you have trader for longer than five minutes, chances are you have heard the phrase “The trend is your friend”. If you have traded longer than 5 weeks, you are more than likely sick and tired of hearing that exact same phrase. It is a phrase however that has a sound financial basis, and should be noted, however I think should be expanded slightly to; “The trend is your friend … if your friend is the trend”.
What I mean but that is the trend is only your friend, if the trading system you employ is set-up to take advantage of
these trends. A trend useless to you if your method is looking changes of emotion in the market. Some examples of this are breakout strategies, price exhaustion stratezies and reversal trading.
A strong trend is like a strong current in the ocean, it is something that should not be swum against, as all you will
do is tire yourself physically, emotionally and mentally, so that you will be to exhausted to take advantage of things
when the current subsides, or changes. If a current (trend) is weak however, you may be able to get a head start on the other swimmers, if the target (shore) is near. A calm ocean, with no current, i.e. a market with no trend, should be the easiest swimming conditions of them all, yet continually many flounder under those conditions as they try to swim with a current that is no longer there. These three trending conditions need to be identified, and the trading strategy adjusted accordingly.
I may have lost some with the whole ocean analogy but the point is, how the market is feeling needs to be identified. If the market is comfortable, happy and emotionless this is when you will see consistent trending conditions where
straight trend lines and fibonacci levels are honoured. If the market is moody, depressed or angry, this is where you
will see ranging, whipsaw action that will leave traders still trying to trade a trend (swim with a current that isn’t there) beating their heads against a wall wondering why their system is broken. It isn’t broken of course, the market just isn’t in the mood for a trending system. It is out of energy, frustrated and indecisive, best to just tread lightly and let the market rest.
Market Excitement: Acceleration
Most of the time, this would be the area that we talk about Momentum rather than Acceleration. Momentum is
something that is mentioned in most trading systems.However the scientific definition of momentum is “The mass
of an object multiplied by it’s velocity”. For me this doesn’t really fit in a trading context, especially in the currency
market as the mass of the market, i.e how many traders are on board, can’t really be measured due to the lack of
accurate volume information.
Instead, I would suggest we are not looking at momentum at all, but rather Acceleration, which is defined as “the rate
of change of velocity of an object with respect to time”. The object of course is price, and price can certainly be measure against time in the trading environment. The quicker price moves up or down, the great the acceleration of price, it is perhaps a small thing, but it can help to know what we are really looking at.
Acceleration is a sign of the excitement levels of the market. Think of a 5 year old, tell that 5 year old that over on the
desk is a piece of broccoli, can they please go over and eat it. What do you think that child would do (after the tantrum)?Most likely walk slowly at best, there is no reason to rush as there is nothing exciting to be found.
Tell that same child that their is a bag of lollies however, and most likely they would be in a full sprint before you can finish the sentence, why? Because they are excited of course, is so the speed they travel to their destination is quicker.
An accelerating market is the same, it is buzzing with excitement, something is going to happen, or has happened
that has excited the market so much that price is racing along at breakneck speed. If this happens out of a period of
congestion, we may be seeing the start of a new trend, if we are at the end of a prolonged trend, we need to be wary this could be the last exhaustive run before the market collapses in a heap and sleeps, lollies in hand.
Market Thinking: Volatility
Volatility is something that can easily be overlooked as a random phenomenon in trading, however it is the core of this system and I think something you overlook at your own peril.I always bring up this example when explaining volatility that helped convince me that it is something worth including. Think about a time when there was an important decision to be made in your life, be it marriage, children, choice of high school subjects, girlfriend, prom date, etc. etc. What do you do before making that decision?, my guess would be you “stop and think”. If something is viewed as being important, you usually don’t want to rush in and make a decision on that issue until you are sure you have all the facts.
It is no different in trading, you see it almost every week, a period of relative quiet, before an explosive move in a
particular direction. For those that follow fundamentals, this is almost always seen in the day(s) leading up to a major economic news announcement, such as inflation figures and interest rate announcements, but is also seen at other times,where there doesn’t seem to be any other reason other than the market is resting, or stopping to think.
For the technically minded you will see this phenomenon on an intraday basis around important support and resistance areas, such as round numbers, trend lines and pivots, and quite often form the well known technical patterns of double tops and bottoms, head and shoulder formations, triangles and changes in polarity.
Summary
So that’s it, we want a system to be able to tell us what mood the market is is, if it is excited or depressed and what it is thinking. The market is a moody beast that is impossible to tame in truth, but knowing it’s mood will get you trading a market during the least dangerous times, when the odds are stacked in your favour to come out the other side relatively unscathed.The following pages will list some indicators the “Not So Squeezy” method uses and why they are used, it is not a hard and fast rule that you have to use each indicator suggested, you may find a different indicator serves you better, but remember what the indicator is measuring in the first place.
I won’t go into the nuts and bolts of what the Bollinger Bands are here, if you really want to know, the best place
to look is http://www.bollingerbands.com where you will find a great explanation on where they originated from. The main thing to realize is that Bollinger Bands provide a relative definition of high and low, and they can be used to
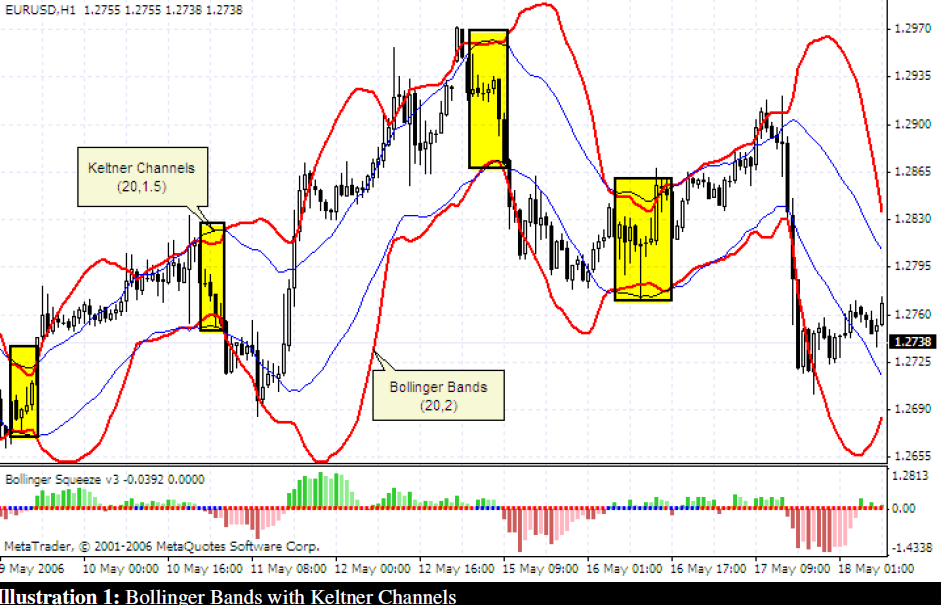
measure the relative volatility of an instrument.The Bollinger Squeeze indicator is a combination of the Bollinger Bands, and another envelope indicator called the Keltner channels (more information can be found here). The premise is, when market activity quietens enough for the Bollinger Bands to move inside the Keltner channels, the time is ripe a big move.
This is the scenario I mentioned early, when I talked about big decisions and the tendency for people to “stop and
think”. It is a sign that something major is on the horizon,whether it be through a news release, approaching major support or resistance levels, or at times more commonly,simply a change in market sentiment.Have a look at Illustration 1 above, on the main chart are the Bollinger Bands and Keltner channels on a chart together. You can see the yellow highlighted areas are where the Bollinger Bands have moved inside the Keltner channels, and a subsequent move has followed.
Below the main chart is a version of the Bollinger Squeeze indicator that is most commonly seen around the trading
world. In this chart, the blue dots correspond to when the Bollinger Bands are inside the Keltner Channels, where the
red dots are when the Bollinger Bands are outside the Keltner Channels.Now you may think I have done the usual authoring thing, and carefully chosen an appropriate chart from some time in history to demonstrate my point, but this is an extremely common looking chart, I could have chosen any of the majors and showed you a chart that looked very similar. Pull up any chart you wish you will see the same patterns just about every day, go on try it 🙂
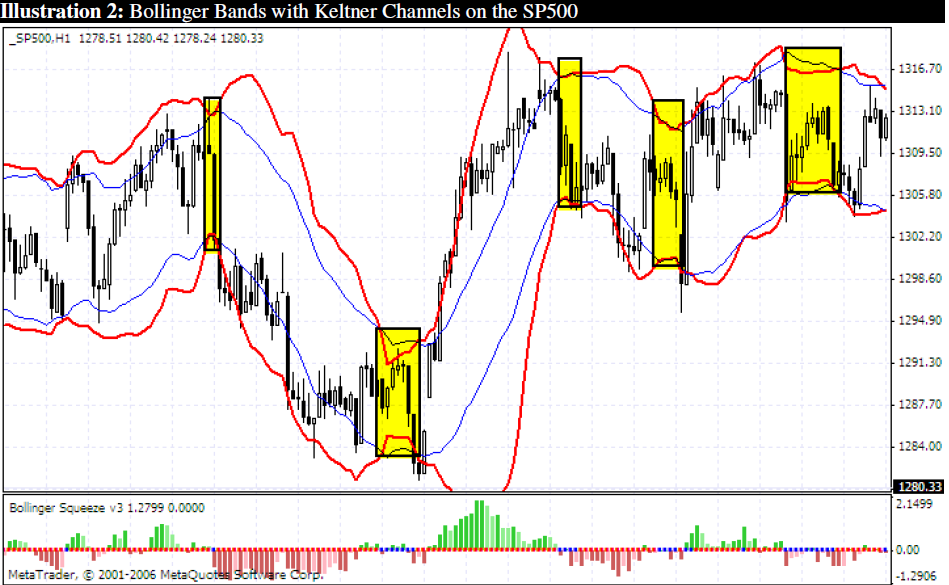
I have previously testing this on things like the NASDAQ,SP500, Gold and various other commodity charts, and the
patterns are the same. As a demonstration, Illustration 2 is the SP500 chart as I write this manual, marked in yellow
are areas where moves were predicted. Why are they the same in all markets?, because the squeeze is a measure of emotion, of when people have “stopped to think” and all markets are driven by the ultimate in emotional beings, us.
The Bollinger Squeeze is far from a new concept, indeed it is with the Keltner channels is a slightly newer concept, but again not something that isn’t widely used, we are not trying to break new ground, we are just trying to find something that will tell us when the market has stopped to think, and I have found nothing better.
Now before you all go off excitedly, there is one major flaw in the Bollinger Squeeze, Keltner Channel method, while it provides excellent timing, it doesn’t indicate the most important factor, that being direction. Times when volatility
is so low give little to indicate which way the market will go.
The reason why is the very reason the squeeze is in place in the first place. It is because everyone has stopped to
think, as they try to figure out which way the next strong push should go. The decision may be that change needs to
be made, or it may be that things were fine the way they were, it is something we will explore a little later.

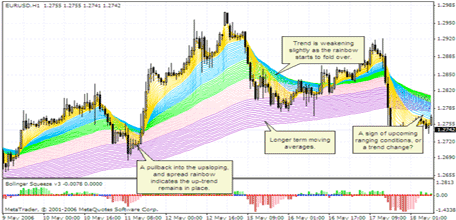
The next indicator used is something I call the Rainbow Multiple Moving Average (RMMA). It is, essentially not really an indicator in the traditional sense, it is actually just eighty eight Exponential Moving Averages (EMA’s), all on the same chart coloured like a rainbow, hence the name.
Author: AKUMA99
To read More,Please download the book.
binary options trader, Bollinger Squeeze indicator, forex bonus without deposit, Forex Broker, forex broker bonus, Forex Education, forex learn, forex learning, forex learning pdf, forex tutorials for beginners pdf, how to trade forex for beginners pdf, learning forex trading pdf, Market, Market Excitement, Multiple Moving Average, Not So Squeezy
Similar Videos and E-books


LEAVE A COMMENT
All Books
For Beginners
- Candlesticks For Support And Resistance
- Online Trading Courses
- Commodity Futures Trading for Beginners
- Hidden Divergence
- Peaks and Troughs
- Reverse Divergences And Momentum
- Strategy:10
- The NYSE Tick Index And Candlesticks
- Trend Determination
- The Original Turtle Trading Rules
- Introduction to Forex
- The Six Forces of Forex
- Study Book for Successful Foreign Exchange Dealing
- Forex. On-Line Manual for Successful Trading
- 18 Trading Champions Share Their Keys to Top Trading Profits
- The Way to Trade Forex
- The Truth About Fibonacci Trading
- Quick Guide to Forex Trading
- Chart Patterns and Technical Indicators
- Forex Trading
- Trading Forex: What Investors Need to Know
- My Dog Ate My Forex
- Point & Figure for Forex
Forex Market in General
- Screen Information, Trader Activity, and Bid-Ask Spreads in a Limit Order Market
- Strategic experimentation in a dealership market
- Limit Orders, Depth, and Volatility
- Reminiscences of a Stock Operator
- Market Profile Basics
- Quote Setting and Price Formation in an Order Driven Market
- Phantom of the Pits
- An Introduction to Market Profile and a Users Guide to Capital Flow Software
- The Effect of Tick Size on Volatility, Trader Behavior, and Market Quality
- Trading as a Business
- What Moves the Currency Market?
- Macroeconomic Implications of the Beliefs and Behavior of Foreign Exchange Traders
- All About the Foreign Exchange Market in the United States
Psychology of Trading
- A Course in Miracles
- Thoughts on Trading
- Calming The Mind So That Body Can Perform
- Lifestyles of the Rich and Pipped
- The Miracle of Discipline
- Zoom in on Personal Trading Behavior And Profit from It
- The Woodchuck and the Possum
- 25 Rules Of Forex Trading Discipline
- Stop Losses Are For Sissies
- Your Personality and Successful Trading
- Trading as a Business
- The 7 Deadly Sins of Forex (and How to Avoid Them)
- The 5 Steps to Becoming a Trader
Money Management
- Risk Control and Money Management
- Money Management
- Position-sizing Effects on Trader Performance: An experimental analysis
- Fine-Tuning Your Money Management System
- Money Management: Controlling Risk and Capturing Profits
- Money Management Strategies for Serious Traders
- The Truth About Money Management
- Money Management and Risk Management
Forex Strategy
- 1-2-3 System
- Bollinger Bandit Trading Strategy
- Value Area
- The Dynamic Breakout II Strategy
- Ghost Trader Trading Strategy
- King Keltner Trading Strategy
- Scalp Trading Methods
- LSS - An Introduction to the 3-Day Cycle Method
- Market Turns And Continuation Moves With The Tick Index
- The Money Manager Trading Strategy
- Picking Tops And Bottoms With The Tick Index
- The Super Combo Day Trading Strategy
- The Eleven Elliott Wave Patterns
- The Thermostat Trading Strategy
- Intraday trading with the TICK
- Traders Trick Entry
- Fibonacci Trader Journal
- Rapid Forex
- Microtrading the 1 Minute Chart
- BunnyGirl Forex Trading Strategy Rules and FAQ
- The Daily Fozzy Method
- Forex Traders Cheat Sheet
- Offset Trading
- How to Trade Both Trend and Range Markets by Single Strategy?
- A Practical Guide to Technical Indicators; Moving Averages
- FX Wizard
- FX Destroyer
- A Practical Guide to Swing Trading
- Practical Fibonacci Methods for Forex Trading
- Using The Heikin-Ashi Technique
- The Day Trade Forex System
- 5/13/62
- Not So Squeezy Trading Manual
- KobasFX Strategy
- Killer Patterns
- 3D Trading
- 4 Hour MACD Forex Strategy
- WRB Analysis Tutorial
Advanced Forex Trading
- A New Interpretation of Information Rate
- CCI Manual
- Nicktrader and Jeff Explaining Reverse and Regular Divers
- NickTrader on No Price CCI Divergence Trading
- Are Supply and Demand Driving Stock Prices?
- The Sharpe Ratio
- The Interaction Between the Frequency of Market Quotes, Spread and Volatility in Forex
- Trend Determination
- Trend vs. No Trend
- A Six-Part Study Guide to Market Profile
- How George Soros Knows What He Knows
- Core Point and Figure Chart Patterns
- Coders Guru Full Course
- Point and Figure Charting: a Computational Methodology and Trading Rule Performance in the S&P 500 Futures Market
- Evolving Chart Pattern Sensitive Neural Network Based Forex Trading Agents
- Heisenberg Uncertainty Principle and Economic Analogues of Basic Physical Quantities
- The String Prediction Models as an Invariants of Time Series in Forex Market
- Using Recurrent Neural Networks to Forecasting of Forex
- The New Elliott Wave Rule - Achieve Definitive Wave Counts

