
[text]
Technical Analysis of AUD/CAD Dates 2014.12.05
Written by the technical team of PipSafe Company
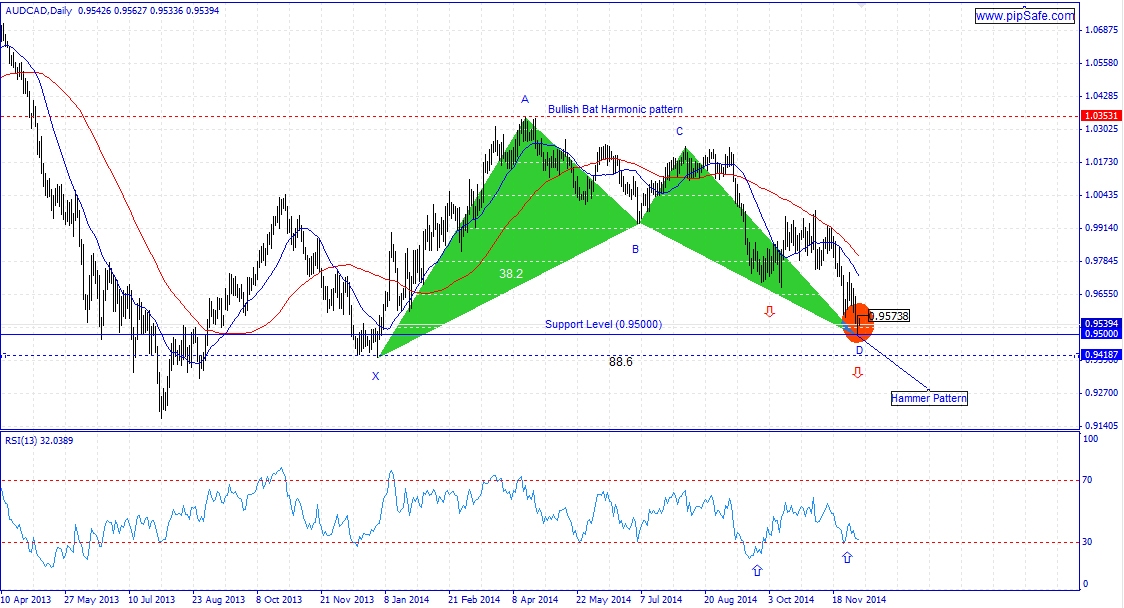
AUD/CAD in recent weeks, has been experienced many reformation with a gradual Downward trend that sellers were successful in obtaining the lowest price of 0.95000.price with reaching to the supportive level which is shown in the picture below( the important round level of 0.95000) has stopped from more descend( sellers used this level to exit their trades) and with formation of a bottom price(Hammer Pattern) in daily time frame has prepared a field for ascending of price.
according to the recent descend the daily candle in previous day was appeared as Hammer candlestick pattern that shows failure of sellers in reaching to the lower prices that for confirmation it needs closing of a bullish candle.RSI indicator is in saturation sell area in daily time frame and in divergence mode with the price chart that warns about changing price direction during the next days.One of the important or the first warnings for increasing of is breaking of resistance level of 0.95738( top level of price changes in the previous daily candle).
[/text]
Categories :
Tags : Analysis AUD/CAD forex bonus without deposit Forex Broker forex broker bonus forex learn forex learning forex learning pdf forex tutorials for beginners pdf how to trade forex for beginners pdf learning forex trading pdf News RSI RSI indicator

