
Forex Trading Classic Chart Patterns – A ringing phone; the first indication that something was wrong. Very wrong.Especially when the person on the other end was Mary. “I own Cisco Systems,”she gloated, and instantly I knew I was in trouble. I also owned the stock, and I knew that whatever Mary bought went down as sure as the sun sets in the west.Mary is new to the world of stock market investing. She believes in fundamental analysis, but does not have the time or inclination to do it properly.Technical analysis? Forget it. If she looks at a stock chart at all, it only shows closing prices—like watching television using only a quarter of the screen.
To her, the small stake in a self-directed IRA—where she trades—is play money as her other, professionally managed retirement accounts hold the bulk of her savings. Make no mistake; she is a very talented, well-respected, senior
vice president making big bucks at a growing company. She is not an early adopter—one who buys the latest cell phone because it is smaller than the dozens she already owns—but one who is willing to pay up for the good life:
the in-ground swimming pool, the vacation time-share, dance and piano lessons for the kids, the BMW, the SUV, the frequent vacations to exotic locales. In other words, she lives well.
I am jealous.THE NOVICE EXPERIENCE Enough about Mary. Let us turn to the trade she made in Cisco Systems,
shown in Figure I.1. When she called, I asked her why she bought 85 shares of the stock at 65. Her answer was as you would expect from a believer of fundamental analysis. She said Cisco was a good company with good earnings and
market momentum.
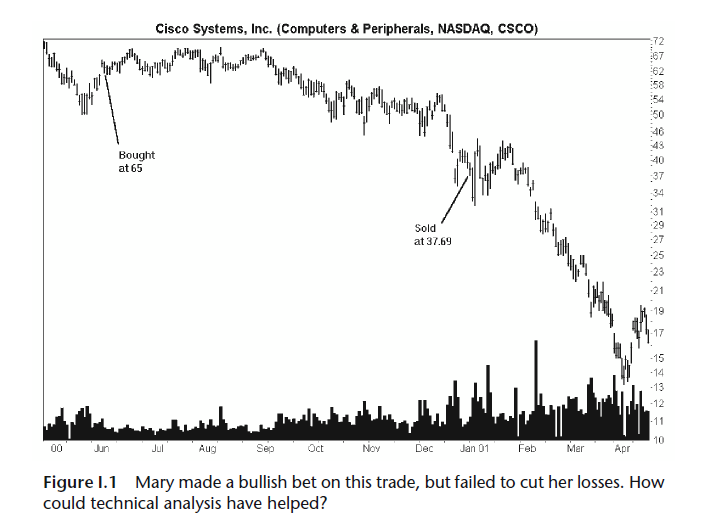
For about 2 weeks, it looked as if she was right. Prices climbed from 65 to a high of 69.56, then bounced between 58 and 70 until September. After that,prices started sliding, slowly at first, but the new trend was clearly down. As
Cisco dropped, it followed the Standard & Poor’s 500 Index lower, almost in lockstep. Like a drain, the declining market acted as a siphon sucking Cisco lower. The Nasdaq Composite meanwhile, formed a double top—peaks in
July and September—with prices confirming the chart pattern in early October.
A bearish signal; it was time to pull the trigger.Mary knew none of this; all she cared about was the falling stock price.Why not sell? Good question. Listening to Mary discuss her trades, you can imagine the mental trading blocks building like ants reconstructing a mound after a rain storm. Phrases such as, “As soon as I sell, prices will rise,” and “It has been dropping for so long that it must be near bottom,” and “As soon as I break even, I will sell,” and, my personal favorite, “I have decided to hold it for the long term,” became part of the lexicon, the justification for holding onto a losing position.
On December 29, Mary sold the stock. Her reason? “I was sick of taking losses.” She received a fill at 37.69, for a tidy 42% loss. The good news, if you can call it that, is that she got out when she did. She could have ridden the stock to its low of 13.19, a massive 80% decline. Still, a 42% loss is not what most would call “cutting your losses short.”
What about my trade? Those who know me understand that I like chart patterns and trade them often. For me, they make it easy to time the market—something the experts claim is impossible to do profitably for any length of
time. You should get used to it, though, because every time you trade, you are timing the market whether you want to admit it or not.During bear markets, bullish chart patterns are like budding flowers in winter: a rare sight. As soon as the market turns, it is as if spring arrives and the head-and-shoulders bottoms, the double bottoms, and other bullish patterns sprout forth and start blooming. The trick is that some of the patterns are weeds and some are orchids; distinguishing them is the subject of this book. I get to that later.
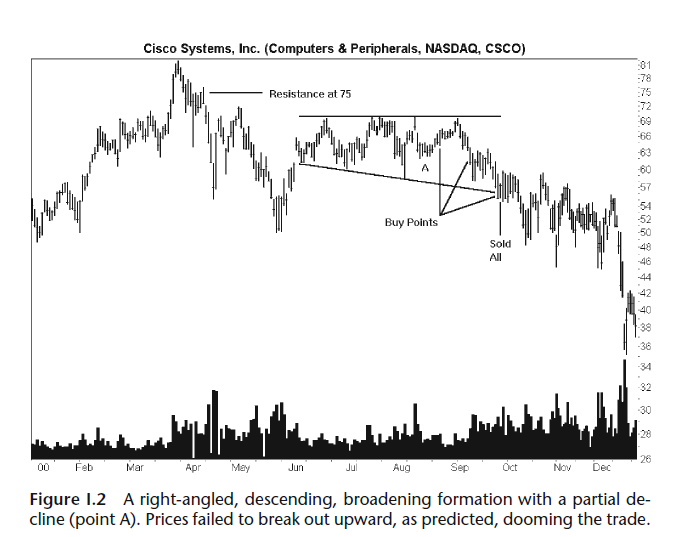
In the meantime, let us return to the Cisco situation. Figure I.2 shows what I saw when I looked at the same chart Mary did (but the time scale is shifted somewhat—the June to December periods overlap). The precise name
for this chart pattern is a broadening formation, right-angled and descending. It sports a flat top, a down-sloping trend along the minor lows, and a volume pattern that can best be described as irregular. This pattern is as rare as finding water in a desert.
A computerized notebook chronicles my trading experience, so I can watch for bad habits forming and learn from past mistakes. Here is what I wrote for the first purchase: “8/23/00. I bought 300 shares at the market and
received a fill at 65.97. I expect the last hour rush to push this up even more [I was right. The stock closed at 67.19, which was 6 cents below the daily high].Why buy? Partial decline in a broadening formation, right-angled and
descending. The stock will pause briefly at 70 then zoom up to 75 and on to 80.
I expect help from the Nasdaq Composite that broke out downward from an ascending broadening wedge, pulled back, and should continue higher. Downside is 61.88, where I must sell.”The key is the mention of a partial decline, and it appears at point A in Figure I.2. Prices touch the top trendline then head lower—but do not touch the lower trendline—curl around, and, usually stage an immediate, upward breakout. If things worked out as expected, the stock would have climbed to the resistance area at 75, burned its way through, then paused near the old high
of 82. My guess is that it would stop at the round number 80, a common resistance point, then retrace some of its gains, curve around, and form a second top (for a double-top pattern). The trick would be to sell near the top.None of that happened. After tagging the top trendline, prices moved lower in a stair-step decline.
Here is the next notebook entry: “Saturday 9/9/00. Trend channels suggest the stock should drop to about 62 (from the current 64) then rise. Prices touch an up trendline drawn from the June 30 low to the present, ignoring the
two down spikes on August 2–3, suggesting a rebound Monday. Stop is still 61.88. The Nasdaq Composite looks as if it double topped, pierced an up trendline, and now appears to be heading down. With September here and October to follow, this might not be a good time to buy. For this stock, the best days to buy are Tuesday and Wednesday [based on linking price changes to days of the week], so I’m going to delay buying.”The general market was now declining—never a good sign when you own a stock. As with many trades, the technical evidence was mixed, but there were warning signs of trouble ahead. Instead: “9/11/00. I bought 200 at 61.25,shooting from the hip. I think that the stock will stop here, and it is a good buyin price. Tomorrow will tell if I am right. Downside is 56–57, upside is 70,pause at 75 then upward to 80.”
Whenever I write the words “shooting from the hip,” it means the trade is about to go bad. These are the trades that feel good, feel right, but never are.Having recently reviewed my 20 years’ worth of trades, I recognize this trading
flaw, and now I know better (which is a good reason to keep a trading notebook: It gives you the ability to recognize a mistake when you make it again!). Notice how the stop-loss price magically changed from 61.88 to 56–57. A lowered stop is another warning of a trade gone bad.“9/26/00. I bought 300 at the market open and received a fill at 58.16.
Indicators were almost uniformly negative. Outside day [a chart pattern] with the close near the lower end implies a lower low today. Right-angled broadening formation meant that I couldn’t tell the breakout direction.
Measured move down chart pattern from 69.63 to 58 then 63.63 to . . . 52. But did I listen?No. I bought anyway and the stock moved below the formation with bid/ask of 54.75–54.88, well below the stop price of 56.” Averaging down in a falling market is never a good idea, but it is a common mistake for novice investors and turkeys like me—ones who know better. After I bought, the stock closed outside the chart pattern, signaling a downward breakout. Even though I made a host of mistakes in this trade, at least I got one thing right: “9/27/00. I sold all 800 shares this morning as the stock had breached the lower trendline boundary of a descending right-angled broadening formation. Lessons on this trade: If an upside breakout from a partial decline does not appear immediately, sell. Do not buy more as the stock moves to the other side of the formation. I received a fill at 56.13, about a point higher than yesterday’s close.”
To read more,Please download the book.
Thomas N. Bulkowski
binary options learn, binary options strategy pdf, binary trading strategies pdf, Classic Chart Patterns, forex bonus without deposit, Forex Broker, forex broker bonus, forex learn, forex learning, forex learning pdf, forex trading learn, forex tutorials for beginners pdf, how to trade forex for beginners pdf, learn binary, learn forex market, learn forex market trading, learning forex trading online, learning forex trading pdf, trading binary options strategies and tactics pdf free, Trading Classic Chart Patterns
Similar Videos and E-books


LEAVE A COMMENT
All Books
For Beginners
- Candlesticks For Support And Resistance
- Online Trading Courses
- Commodity Futures Trading for Beginners
- Hidden Divergence
- Peaks and Troughs
- Reverse Divergences And Momentum
- Strategy:10
- The NYSE Tick Index And Candlesticks
- Trend Determination
- The Original Turtle Trading Rules
- Introduction to Forex
- The Six Forces of Forex
- Study Book for Successful Foreign Exchange Dealing
- Forex. On-Line Manual for Successful Trading
- 18 Trading Champions Share Their Keys to Top Trading Profits
- The Way to Trade Forex
- The Truth About Fibonacci Trading
- Quick Guide to Forex Trading
- Chart Patterns and Technical Indicators
- Forex Trading
- Trading Forex: What Investors Need to Know
- My Dog Ate My Forex
- Point & Figure for Forex
Forex Market in General
- Screen Information, Trader Activity, and Bid-Ask Spreads in a Limit Order Market
- Strategic experimentation in a dealership market
- Limit Orders, Depth, and Volatility
- Reminiscences of a Stock Operator
- Market Profile Basics
- Quote Setting and Price Formation in an Order Driven Market
- Phantom of the Pits
- An Introduction to Market Profile and a Users Guide to Capital Flow Software
- The Effect of Tick Size on Volatility, Trader Behavior, and Market Quality
- Trading as a Business
- What Moves the Currency Market?
- Macroeconomic Implications of the Beliefs and Behavior of Foreign Exchange Traders
- All About the Foreign Exchange Market in the United States
Psychology of Trading
- A Course in Miracles
- Thoughts on Trading
- Calming The Mind So That Body Can Perform
- Lifestyles of the Rich and Pipped
- The Miracle of Discipline
- Zoom in on Personal Trading Behavior And Profit from It
- The Woodchuck and the Possum
- 25 Rules Of Forex Trading Discipline
- Stop Losses Are For Sissies
- Your Personality and Successful Trading
- Trading as a Business
- The 7 Deadly Sins of Forex (and How to Avoid Them)
- The 5 Steps to Becoming a Trader
Money Management
- Risk Control and Money Management
- Money Management
- Position-sizing Effects on Trader Performance: An experimental analysis
- Fine-Tuning Your Money Management System
- Money Management: Controlling Risk and Capturing Profits
- Money Management Strategies for Serious Traders
- The Truth About Money Management
- Money Management and Risk Management
Forex Strategy
- 1-2-3 System
- Bollinger Bandit Trading Strategy
- Value Area
- The Dynamic Breakout II Strategy
- Ghost Trader Trading Strategy
- King Keltner Trading Strategy
- Scalp Trading Methods
- LSS - An Introduction to the 3-Day Cycle Method
- Market Turns And Continuation Moves With The Tick Index
- The Money Manager Trading Strategy
- Picking Tops And Bottoms With The Tick Index
- The Super Combo Day Trading Strategy
- The Eleven Elliott Wave Patterns
- The Thermostat Trading Strategy
- Intraday trading with the TICK
- Traders Trick Entry
- Fibonacci Trader Journal
- Rapid Forex
- Microtrading the 1 Minute Chart
- BunnyGirl Forex Trading Strategy Rules and FAQ
- The Daily Fozzy Method
- Forex Traders Cheat Sheet
- Offset Trading
- How to Trade Both Trend and Range Markets by Single Strategy?
- A Practical Guide to Technical Indicators; Moving Averages
- FX Wizard
- FX Destroyer
- A Practical Guide to Swing Trading
- Practical Fibonacci Methods for Forex Trading
- Using The Heikin-Ashi Technique
- The Day Trade Forex System
- 5/13/62
- Not So Squeezy Trading Manual
- KobasFX Strategy
- Killer Patterns
- 3D Trading
- 4 Hour MACD Forex Strategy
- WRB Analysis Tutorial
Advanced Forex Trading
- A New Interpretation of Information Rate
- CCI Manual
- Nicktrader and Jeff Explaining Reverse and Regular Divers
- NickTrader on No Price CCI Divergence Trading
- Are Supply and Demand Driving Stock Prices?
- The Sharpe Ratio
- The Interaction Between the Frequency of Market Quotes, Spread and Volatility in Forex
- Trend Determination
- Trend vs. No Trend
- A Six-Part Study Guide to Market Profile
- How George Soros Knows What He Knows
- Core Point and Figure Chart Patterns
- Coders Guru Full Course
- Point and Figure Charting: a Computational Methodology and Trading Rule Performance in the S&P 500 Futures Market
- Evolving Chart Pattern Sensitive Neural Network Based Forex Trading Agents
- Heisenberg Uncertainty Principle and Economic Analogues of Basic Physical Quantities
- The String Prediction Models as an Invariants of Time Series in Forex Market
- Using Recurrent Neural Networks to Forecasting of Forex
- The New Elliott Wave Rule - Achieve Definitive Wave Counts

