KOBASFX STRATEGY – The strategy is very simple and it is called KobasFX. I will explain everything here but
incase you would want me to explain to you one on one or would want me to tutor you on Forex trading, then you would have to pay a token for that.
Timeframe: Any (but I recommend from 15 minutes chart and above)
Indicators: Moving averages (Exponential)
i. Period 5 (Yellow)
ii. Period 10 (Magenta)
iii. Period 15 (Red)
iv. Period 65 (White)
MACD (Default settings)
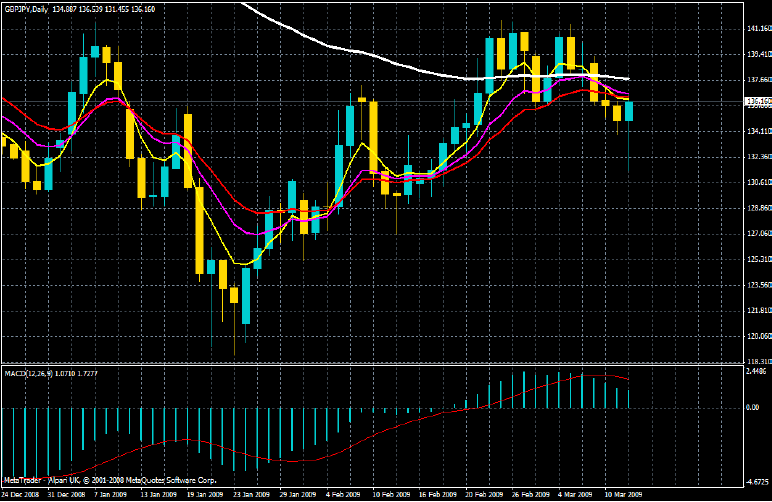
You can also change the colors to Red and Dark Turquoise as shown below.
 .
.
Entry Signals
The signals are classified into 5 sentiments for the indicators
i. Bullish
ii. Bearish
iii. Consolidation
iv. Bullish Consolidation
v. Bearish Consolidation
Which means that the moving averages and the MACD can give signals based on any of the 5 sentiments.
Although, we have four Exponential moving average indicators but, I will classify them as two different indicators i.e, 5, 10 and 15 as one and then 65 as another indicator for our signals.
We now we have:
Indicator 1 – EMA (5, 10, 15)
Indicator 2 – EMA (65)
Indicator 3 – MACD with Red and Dark Turquoise colors.
SIGNALS FOR EACH INDICATOR
Indicator 1: Whenever there is a crossover of the three EMA (5, 10, 15), then wait until they split distinctively according to the periods or colors as shown on the chart, then a BUY or SELL is confirmed depending on the direction at that point in time (Bullish or Bearish).
If they are all together, that means consolidation.
Indicator 2: Check the angle of the 65 EMA
Upward angle: Bullish (BUY)
Downward angle: Bearish (SELL)
Flat: Consolidation (NO TRADE)
Indicator 3: MACD
Red line is the MACD signal line
Dark Turquoise bars are the MACD cloud
Zero level (0.00) separates BUY/SELL regions
If the Red line is above the zero level (0.00), that means BUY (Bullish) but if it is below the zero line it means SELL (Bearish).
If the Dark Turquoise bars are above/below the zero line, that means BUY (Bullish)/SELL (Bearish).
If the MACD signal line (Red line) is inside the MACD cloud (Dark Turquoise),above/below the zero (0.00) line, that means BUY(Bullish)/SELL(Bearish).
If the MACD signal line (Red line) comes out from the MACD cloud (Dark Turquoise) above/below the zero (0.00) line, that means Bullish consolidation/Bearish consolidation.Now, let me bring everything together. You must make sure that you consider these five sentiments before taking a trade:
i. Check the three EMA (5, 10, 15).
ii. Is the market trading above or below the white line (65 EMA)?
iii. Check the angle of the white line (65 EMA).
iv. Check if the MACD signal line (Red line) is above/below the zero(0) level
v. Check if the MACD signal line (Red line) inside the MACD cloud.
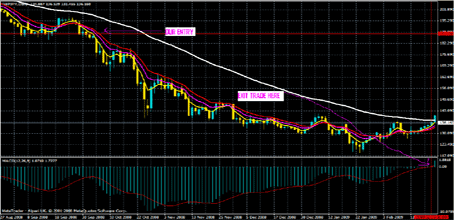
Let’s apply all the rules on the market and see:
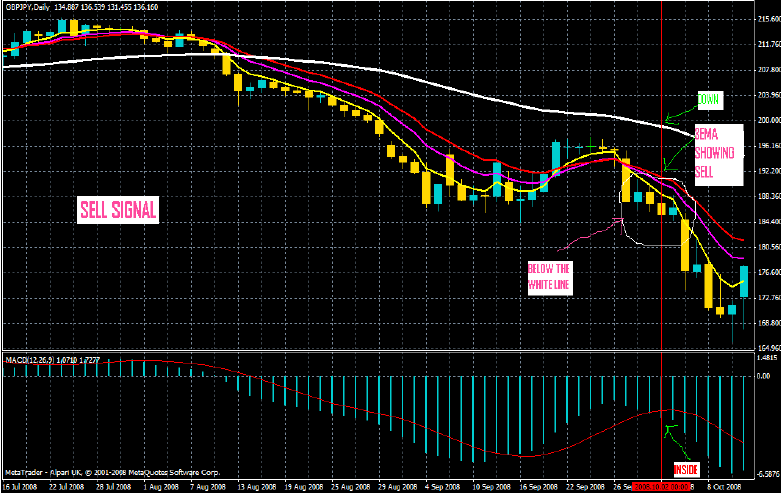
As you can see on the chart above, the 3 EMA (5, 10, 15) separated (SELL) and the candles are below the white line (SELL). The white line (65 EMA) was angling down (SELL) and at the same time the MACD signal line (Red line) was below the zero level (0.00) (SELL) and entering the MACD cloud (Dark Turquoise) (SELL).
For every signal, make sure the five sentiments shows BUY/SELL before you take a trade.
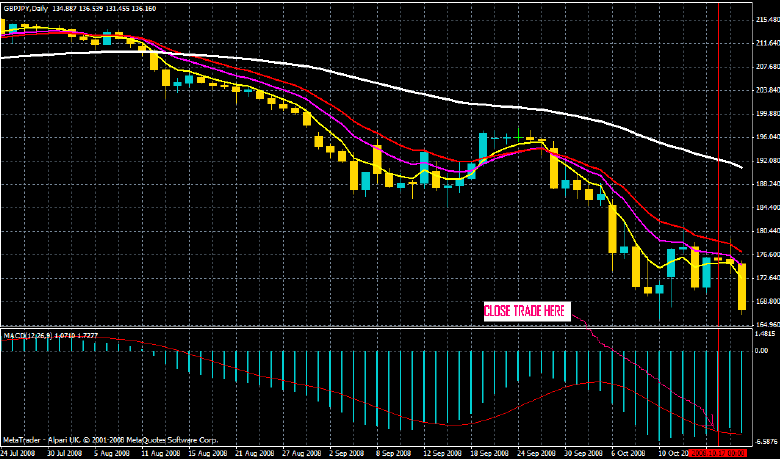
Exit Signals
You can pullout from a trade when the MACD signal line (Red line) comes out of the MACD cloud for short time traders or when the signal line crosses above/below the zero level (0.00) in an opposite direction of our trade for position traders. Look at the chart below:
Author: Name: Obaseki O. A.
Download KOBASFX STRATEGY, KOBASFX STRATEGY, KOBASFX STRATEGY PDF, MACD, MACD System
Similar Videos and E-books


LEAVE A COMMENT
All Books
For Beginners
- Candlesticks For Support And Resistance
- Online Trading Courses
- Commodity Futures Trading for Beginners
- Hidden Divergence
- Peaks and Troughs
- Reverse Divergences And Momentum
- Strategy:10
- The NYSE Tick Index And Candlesticks
- Trend Determination
- The Original Turtle Trading Rules
- Introduction to Forex
- The Six Forces of Forex
- Study Book for Successful Foreign Exchange Dealing
- Forex. On-Line Manual for Successful Trading
- 18 Trading Champions Share Their Keys to Top Trading Profits
- The Way to Trade Forex
- The Truth About Fibonacci Trading
- Quick Guide to Forex Trading
- Chart Patterns and Technical Indicators
- Forex Trading
- Trading Forex: What Investors Need to Know
- My Dog Ate My Forex
- Point & Figure for Forex
Forex Market in General
- Screen Information, Trader Activity, and Bid-Ask Spreads in a Limit Order Market
- Strategic experimentation in a dealership market
- Limit Orders, Depth, and Volatility
- Reminiscences of a Stock Operator
- Market Profile Basics
- Quote Setting and Price Formation in an Order Driven Market
- Phantom of the Pits
- An Introduction to Market Profile and a Users Guide to Capital Flow Software
- The Effect of Tick Size on Volatility, Trader Behavior, and Market Quality
- Trading as a Business
- What Moves the Currency Market?
- Macroeconomic Implications of the Beliefs and Behavior of Foreign Exchange Traders
- All About the Foreign Exchange Market in the United States
Psychology of Trading
- A Course in Miracles
- Thoughts on Trading
- Calming The Mind So That Body Can Perform
- Lifestyles of the Rich and Pipped
- The Miracle of Discipline
- Zoom in on Personal Trading Behavior And Profit from It
- The Woodchuck and the Possum
- 25 Rules Of Forex Trading Discipline
- Stop Losses Are For Sissies
- Your Personality and Successful Trading
- Trading as a Business
- The 7 Deadly Sins of Forex (and How to Avoid Them)
- The 5 Steps to Becoming a Trader
Money Management
- Risk Control and Money Management
- Money Management
- Position-sizing Effects on Trader Performance: An experimental analysis
- Fine-Tuning Your Money Management System
- Money Management: Controlling Risk and Capturing Profits
- Money Management Strategies for Serious Traders
- The Truth About Money Management
- Money Management and Risk Management
Forex Strategy
- 1-2-3 System
- Bollinger Bandit Trading Strategy
- Value Area
- The Dynamic Breakout II Strategy
- Ghost Trader Trading Strategy
- King Keltner Trading Strategy
- Scalp Trading Methods
- LSS - An Introduction to the 3-Day Cycle Method
- Market Turns And Continuation Moves With The Tick Index
- The Money Manager Trading Strategy
- Picking Tops And Bottoms With The Tick Index
- The Super Combo Day Trading Strategy
- The Eleven Elliott Wave Patterns
- The Thermostat Trading Strategy
- Intraday trading with the TICK
- Traders Trick Entry
- Fibonacci Trader Journal
- Rapid Forex
- Microtrading the 1 Minute Chart
- BunnyGirl Forex Trading Strategy Rules and FAQ
- The Daily Fozzy Method
- Forex Traders Cheat Sheet
- Offset Trading
- How to Trade Both Trend and Range Markets by Single Strategy?
- A Practical Guide to Technical Indicators; Moving Averages
- FX Wizard
- FX Destroyer
- A Practical Guide to Swing Trading
- Practical Fibonacci Methods for Forex Trading
- Using The Heikin-Ashi Technique
- The Day Trade Forex System
- 5/13/62
- Not So Squeezy Trading Manual
- KobasFX Strategy
- Killer Patterns
- 3D Trading
- 4 Hour MACD Forex Strategy
- WRB Analysis Tutorial
Advanced Forex Trading
- A New Interpretation of Information Rate
- CCI Manual
- Nicktrader and Jeff Explaining Reverse and Regular Divers
- NickTrader on No Price CCI Divergence Trading
- Are Supply and Demand Driving Stock Prices?
- The Sharpe Ratio
- The Interaction Between the Frequency of Market Quotes, Spread and Volatility in Forex
- Trend Determination
- Trend vs. No Trend
- A Six-Part Study Guide to Market Profile
- How George Soros Knows What He Knows
- Core Point and Figure Chart Patterns
- Coders Guru Full Course
- Point and Figure Charting: a Computational Methodology and Trading Rule Performance in the S&P 500 Futures Market
- Evolving Chart Pattern Sensitive Neural Network Based Forex Trading Agents
- Heisenberg Uncertainty Principle and Economic Analogues of Basic Physical Quantities
- The String Prediction Models as an Invariants of Time Series in Forex Market
- Using Recurrent Neural Networks to Forecasting of Forex
- The New Elliott Wave Rule - Achieve Definitive Wave Counts

