What is Forex Oscillator and why do we need them?
This is a technical analysis ratio which is used to forecast Forex market.The oscillators are calculated by indicators, using the moving average. In order to calculate Forex oscillators such as price, as well as some of volume indicators are sued. Although the analysis and use of oscillators best of all are represented at the constant state of market, the time of trend reversal can also be determined by their help.To identify a trend reversal it’s necessary to understand the concepts of convergence and divergence of the curve oscillator with the direction of price movements.
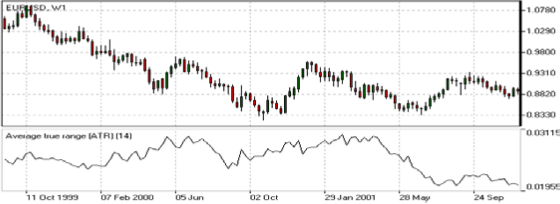
Average True Range (ATR) Indicator -Average True Range – ATR Definition
The Average True Range (ATR) indicator was introduced by Welles Wilder as a tool to measure the market volatility
and volatility alone leaving aside attempts to indicate the direction. Unlike the True Range, the ATR also includes
volatility of gaps and limit moves. The indicator is good at valuating the market’s interest in the price moves for
strong moves and break-outs are normally accompanied by large ranges.
How to Use the Average True Range Indicator?
The ATR is used with 14 periods with daily and longer time frames and reflects the volatility values that are in relation to the trading instrument’s price. Low ATR values would normally correspond to a range trading while high values may indicate a trend breakout or breakdown.
AverAge True rAnge (ATr) IndIcATor cAlculATIon
Average True Range is a moving average of the True Range which is the greatest of the following three values:
• The distance from today’s high to today’s low.
• The distance from yesterday’s close to today’s high.
• The distance from yesterday’s close to today’s low.
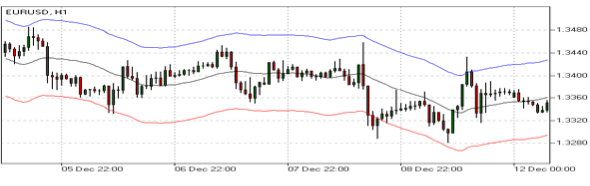
Bollinger Band Indicator (How to Use Bollinger Bands)
PurPose
The Bollinger Bands indicator (named after its inventor) displays the current market volatility changes, confirms
the direction, warns of a possible continuation or break-out of the trend, periods of consolidation, increasing
volatility for break-outs as well as pinpoints local highs and lows.
usAge (How to Use Bollinger Bands in Forex)
The indicator consists of the three moving averages:
• Upper band – 20-day simple moving average (SMA) plus double standard price deviation.
• Middle band – 20-day SMA.
• Lower band – 20-day SMA minus double standard price deviation.
The increasing distance between the upper and the lower bands while volatility is growing, suggests of a
price developing in a trend which direction correlates with the direction of the Middle line. In contrast to the
above, at times of decreasing volatility when the bands are closing in, we should be expecting the price
to move side wards in a range.
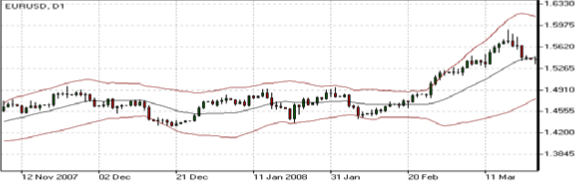
The price moving outside the Bands may indicate either the trend’s continuation (when the bands are floating
apart as the volatility increases) or the U-turn of the trend if the initial movement is exhausted. Either way each of the scenarios must be confirmed by other indicators such as RSI,ADX or MACD. Anyhow the price crossing of the Middle line from below or above may be interpreted as a signal to buy or to sell respectively.
BollInger BAnd IndIcATor cAlculATIon (Bollinger Bands Indicator To trading)
The middle line (ML) is a regular Moving Average:
ML = SUM [CLOSE, N]/N
The top line (TL) is ML a deviation (D) higher:
TL = ML + (D*StdDev)
The bottom line (BL) is ML a deviation (D) lower.
BL = ML — (D*StdDev)
Commodity Channel Index (CCI) Indicator (How to Use the CCI Indicator)
PurPose
The Commodity Channel Index is an indicator by Donald Lambert. Despite the original purpose to identify new
trends, it’s nowadays widely used to measure the current price levels in relation to the average one.
usAge (How to Trade CCI in Forex Market)
The indicator oscillates around the naught line tending to stay within the range from -100 to +100. The naught line represents the level of an average balanced price. The higher the indicator surges above the naught line the more overvalued the security is. The further the indicator plunges into the negative area the more potential for growth the price may have.
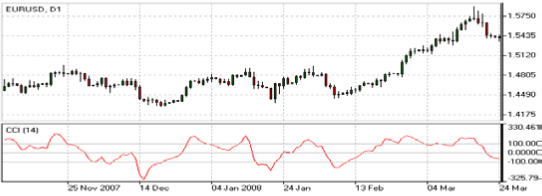
Still the unbalanced price alone may not serve as a clear indicator neither to the direction the price is following nor to its strength. There are critical values and the crossing directions which need to be looked at closely:
• Exceeding past the 100 level suggests a possible further upward movement
• Decreasing past the 100 level indicates a U-turn and serves as a signal to sell.
• Decreasing past the -100 level suggests a possible further downward movement
• Exceeding past the -100 level indicates a U-turn and serves as a signal to buy.
• Crossing the naught line upwards from below serves as a confirmation to buy
• Crossing the naught line downwards from above serves a confirmation to sell.
Smaller indicator period increases its sensitivity. Shifting critical levels to 200 allows to exclude insignificant price
fluctuations.
commodITy chAnnel Index (ccI) IndIcATor cAlculATIon
A complete explanation of the CCI calculation is beyond the scope of this book. The following are basic steps
involved in the calculation:
1. Add each period’s high, low, and close and divide this sum by 3. This is the typical price.
2. Calculate an n-period simple moving average of the typical prices computed in Step 1.
3. For each of the prior n-periods, subtract today’s Step 2 value from Step 1’s value n days ago. For example, if
you were calculating a 5-day CCI, you would perform five subtractions using today’s Step 2 value.
4. Calculate an n-period simple moving average of the absolute values of each of the results in Step 3.
5. Multiply the value in Step 4 by 0.015.
6. Subtract the value from Step 2 from the value in Step 1.
7. Divide the value in Step 6 by the value in Step 5.
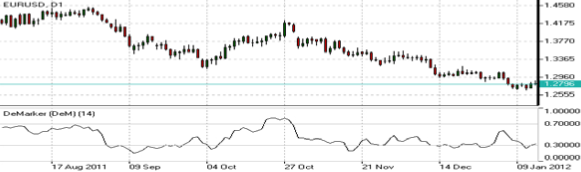
DeMarker Indicator
PurPose (Demarker Indicator Definition)
This indicator was introduced by Tom DeMark as a tool to identify emerging buying and selling opportunities. It
demonstrates the price depletion phases which usually correspond with the price highs and bottoms.The DeMarker indicator proved to be efficient at identifying trend break-downs as well as spotting intra-day entry
and exit points.
usAge (How to Use the DeMarker indicator in Forex)
The indicator fluctuates with a range between 0 to 1 and is indicative of lower volatility and a possible price drop when reading 0.7 and higher, and signals a possible price increase when reading below 0.3.
demArker IndIcATor cAlculATIon (DeMarker Indicator Explained)
The DeMarker indicator is the sum of all price increment values recorded during the “i” period divided by the price
minima:
The DeMax(i) is calculated:
If high(i) > high(i-1) , then DeMax(i) = high(i)-high(i-1), otherwise DeMax(i) = 0
The DeMin(i) is calculated:
If low(i) < low(i-1), then DeMin(i) = low(i-1)-low(i), otherwise DeMin(i) = 0
The value of the DeMarker is calculated as:
DMark(i) = SMA(DeMax, N)/(SMA(DeMax, N)+SMA(DeMin, N))
Envelopes Indicator (Using the Envelopes Indicator for Trading)
PurPose
The Envelopes indicator reflects the price overbought and oversold conditions helping to identify the entry or
exit points as well as possible trend break-downs.
usAge (How to Use the Envelope Indicator in Forex)
The indicator consists of two SMAs that together form a flexible channel in which the price evolves. The averages
are plotted around a Moving Average in a constant percentage distance which may be adjusted according to the current market volatility. Each line serves as a margin of the price fluctuation range.
In a trending market take only oversold signals in an uptrend conditions and overbought signals in a downtrend
conditions.In a ranging market the price reaching the top line serves as a sell signal, while the price at the lower line generates a signal to buy.
enveloPes IndIcATor cAlculATIon
Upper Band = SMA(CLOSE, N)*[1+K/1000]
Lower Band = SMA(CLOSE, N)*[1-K/1000]
Where:
SMA — Simple Moving Average;
N — averaging period;
K/1000 — the value of shifting from the average (measured in basis points).
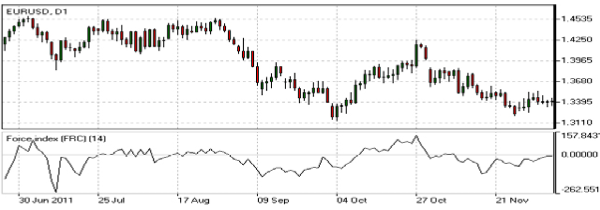
Force Index Indicator – How to Day Trade with the Force Index
PurPose
The Force Index indicator invented by Alexander Elder measures the power behind every price move based on
their three essential elements, e.g., direction, extent and volume. The oscillator fluctuates around the zero, i.e., a
point of a relative balance between power shifts.
usAge (How to Use Force Index Indicator)
The Force Index allows to identify the reinforcement of different time scale trends:
• The indicator should be made more sensitive by decreasing its period for short trends.
• The indicator should be smoothed by increasing its period for longer trends.
• The Force Index may strongly imply a trend change:
• Break-down of an uptrend when the indicator’s value is changing from positive to negative and price and
indicator show divergence.
• Break-down of a downtrend when the indicator’s value is changing from negative to positive and price and
indicator show convergence.
• Together with a trend-following indicator the Force Index can help identify trend corrections:
• An uptrend correction when the indicator bounces off the low.
• A downtrend correction when the indicator slides from a pike.
Force Index IndIcATorcAlculATIon
Force Index(1) = {Close (current period) – Close (prior period)} x Volume
Force Index(13) = 13-period EMA of Force Index(1)
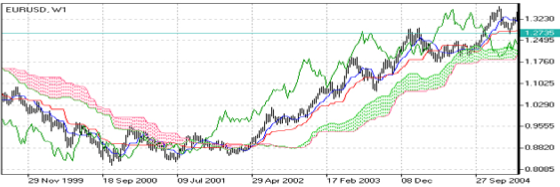
Ichimoku Indicator – An Introduction To Ichimoku In Forex
PurPose (Ichimoku Cloud Definition)
The Ichimoku Kinko Hyo (Equilibrium chart at a glance) is a comprehensive technical analysis tool introduced in
1968 by Tokyo columnist Goichi Hosoda. The concept of the system was to provide an immediate vision of trend
sentiment, momentum and strength at a glance perceiving all the Ichimoku’s five components and a price in terms of interactions among them of a cyclical type related to that of human group dynamics.
usAge (How to Use the Ichimoku Indicator)
The Ichimoku indicator consists of five lines which may all serve as flexible support or resistance lines, whose
crossovers may as well be assumed as additional signals:
1. Tenkan-Sen (Conversion line, blue)
2. Kijun-Sen (Base line, red)
3. Senkou Span A (Leading span A, green boundary of the cloud)
4. Senkou Span B (Leading span B, red boundary of the cloud)
5. Chikou Span (Lagging span, green)
Kumo (Cloud) is a central element of the Ichimoku system and represents support or resistance areas. It is formed
by Leading Span A and Leading Span B.
Determining support and resistance:
• Leading span A serves as a first support line for an uptrend
• Leading span B serves as a second support line for an uptrend
• Leading span A serves as a first resistance line for a downtrend
• Leading span B serves as a second resistance line for a downtrend
Strong Buy/Sell signals occurring above the cloud:

IchImoku IndIcATor cAlculATIon
• Tenkan-Sen (Conversion line, blue) is (9-period high + 9-period low)/2
• Kijun-Sen (Base line, red) is (26-period high + 26-period low)/2
• Senkou Span A (Leading span A, green boundary of the cloud) is (Conversion Line + Base Line)/2
• Senkou Span B (Leading span B, red boundary of the cloud) is (52-period high + 52-period low)/2
• Chikou Span (Lagging span, green) is close price plotted 26 periods in the past
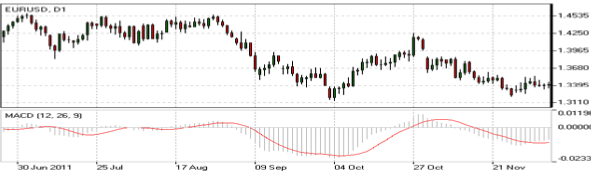
Moving-Average Convergence/Divergence (MACD) Indicator
PurPose (MACD Indicator (Moving Average Convergence Divergence)
Moving-Average Convergence/Divergence Oscillator, commonly referred to as MACD, is an indicator developed
by Gerald Appel which is designed to reveal changes in the direction and strength of the trend by combining
signals from three time series of moving average curves.
usAge (How to Use the MACD Indicator)
Three main signals generated by the indicator (blue line) are crossovers with the signal line (red line), with the
x-axis and divergence patterns.
Crossovers with the signal line:
• If the MACD line is rising faster than the Signal line and crosses it from below, the signal is interpreted as bull-
ish and suggests acceleration of price growth;
• If the MACD line is falling faster than the Signal line and crosses it from above, the signal is interpreted as
bearish and suggests extension of price losses;
Crossovers with the x-axis:
• A bullish signal appears if the MACD line climbs above zero;
• A bearish signal presents if the MACD line falls below zero.
Convergence/Divergence:
• If the MACD line is trending in the same direction as the price, the pattern is known as convergence, which
confirms the price move;
• If they move in opposite directions, the pattern is divergence. For example, if the price reaches a new high,
but the indicator does not, this may be a sign of further weakness.
movIng-AverAge convergence/dIvergence (mAcd) oscIllATorcAlculATIon
MACD line = 12-period EMA – 26-period EMA
Signal line = 9-period EMA
Histogram = MACD line – Signal line
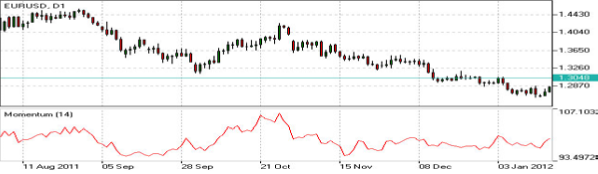
Momentum Indicator – Momentum Indicator Explained
PurPose
Momentum is an indicator that shows trend direction and measures how quickly the price is changing by com-
paring current and past prices.
usAge (How to Use Momentum Indicators)
The indicator is represented by a line, which oscillates around 100. Being an oscillator, momentum should be
used within price trend analysis.
Crossing the x-axis:
• It is believed that if the indicator climbs above 100 during an uptrend, it is a bullish signal;
• Otherwise if the indicator falls below 100 during a downtrend, a bearish signal appears.
Falling out of its normal range:
• Extreme points mean that the price has posted its strongest gain or loss for a particular number of moving
periods, supporting trend strength;
• At the same time if the price movement was too rapid, they may indicate possible overbought and oversold
areas.
Divergence patterns:
• If the price hits a new high, but the indicator does not, that could mean that investor sentiment is actually
lower;
• And on the contrary if the price falls to a new low, but the indicator does not support the drop, it is a signal
that the trend may end soon.
momenTum IndIcATor cAlculATIon
Momentum = (Current close price / Lagged close price) x 100
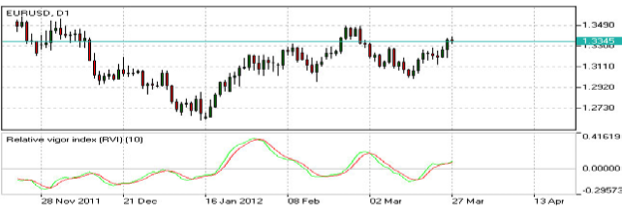
Relative Vigor Index (RVI) Indicator
PurPose (How do I use Relative Vigor Index)
Relative Vigor Index, developed by John Ehlers, is a technical indicator designed to determine price trend direc-
tion. The underlying logic is based on the assumption that close prices tend to be higher than open prices in a
bullish environment and lower in a bearish environment.
UsAge – How to Trade with RVI in the Market
The Relative Vigor Index allows to identify the reinforcement of price changes (and therefore may be used within
convergence/divergence patterns analysis):
• Generally the higher the indicator climbs, the stronger is the current relative price increase;
• Generally the lower the indicator falls, the stronger is the current relative price drop.
Together with its signal line (Red), a 4-period moving average of RVI, the indicator (Green) may help to identify
changes in prevailing price developments:
• Crossing the signal line from above, the RVI signals a possible sell opportunity;
• Crossing the signal line from below, the RVI signals a possible buy opportunity.
relATIve vIgor Index IndIcATor cAlculATIon
Relative Vigor Index (1) = (Close – Open) / (High – Low)
Relative Vigor Index (10) = 10-period SMA of Relative Vigor Index (1)
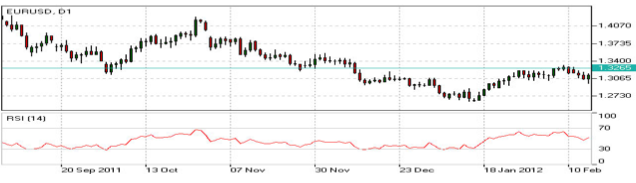
Relative Strength Index (RSI) Indicator – Relative Strength Index
PurPose – Use The Relative Strength Index
Relative Strength Index is an indicator developed by Welles Wilder to assess the strength or the weakness of the
current price movements and to measure the velocity of price changes by comparing price increases with its
losses over a certain period.
usAge
The Relative Strength Index allows to identify possible overbought and oversold areas, but should be considered
within trend analysis:
• Generally if the indicator climbs above 70, the asset may be overbought;
• If the indicator drops below 30, the asset may be oversold.
Leaving extreme areas the indicator may suggest possible corrections or even trend changes:
• Crossing the overbought boundary from above, the RSI signals a possible sell opportunity;
• Crossing the oversold boundary from below, the RSI signals a possible buy opportunity.
Convergence/divergence patterns may indicate possible trend weakness:
• If the price climbs to a new high, but the indicator does not, that may be a sign of the uptrend weakness;
• If the price falls to a new low, but the indicator does not, that may be a sign of the downtrend weakness.
relATIve sTrengTh Index IndIcATor cAlculATIon
RSI = 100 – 100/(1 + RS)
RS (14) = Σ(Upward movements)/Σ(|Downward movements|)
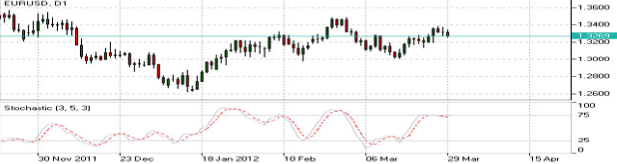
Stochastic Indicator – Stochastic Oscillator Definition
PurPose
Stochastic is an indicator introduced by George Lane to identify price trend direction and possible reversal points
by determining the place of the current close price in the most recent price range, as in a sustainable uptrend
close prices tend to the higher end of the range and to the lower end in a downtrend.
usAge – How to Trade with Stochastic Oscillator
The Stochastic oscillator allows to identify possible overbought and oversold areas, but should be considered
within trend analysis:
• Generally if the indicator climbs above 75, the asset may be overbought;
• If the indicator drops below 25, the asset may be oversold.
Leaving extreme areas the indicator may suggest possible turning points:
• Crossing the overbought boundary from above, the Stochastic signals a possible sell opportunity;
• Crossing the oversold boundary from below, the Stochastic signals a possible buy opportunity.
Crossovers of the indicator with its smoothened signal line, usually a 3-period moving average, may also detect
deal opportunities:
• The indicator suggests going long when crossing the signal line from below;
• The indicator suggests going short when crossing the signal line from above.
Convergence/divergence patterns may indicate possible trend weakness:
• If the price climbs to a new high, but the indicator does not, that may be a sign of the uptrend weakness;
• If the price falls to a new low, but the indicator does not, that may be a sign of the downtrend weakness.
sTochAsTIc IndIcATor cAlculATIon
Stochastic = 100 x ((C – L)/(H – L)); Signal = average of the last three Stochastic values;
C – latest close price; L – the lowest price over a given period;
H – the highest price over a given period.
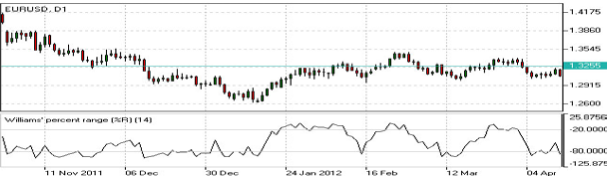
Williams Percent Range (WPR) Indicator – Williams Percent Range Explained
Purpose
Williams Percent Range (%R) is a technical indicator developed by Larry Williams to identify whether an asset is
overbought or oversold and therefore to determine possible turning points. Unlike the Stochastic oscillator Williams
Percent Range is a single line fluctuating on a reverse scale.
usAge (How To Use The Williams % Range)
The main goal of Williams Percent Range is to identify possible overbought and oversold areas, however the indi-
cator should be considered within trend analysis:
• Generally if the indicator climbs above -20, the asset may be overbought;
• If the indicator drops below -80, the asset may be oversold.
Leaving extreme areas the indicator may suggest possible turning points:
• Crossing the overbought boundary from above, Williams Percent Range signals a possible sell opportunity;
• Crossing the oversold boundary from below, Williams Percent Range signals a possible buy opportunity.
Divergence patterns are rare, but may indicate possible trend weakness:
• If the price climbs to a new high, but the indicator does not, that may be a sign of the uptrend weakness;
• If the price falls to a new low, but the indicator does not, that may be a sign of the downtrend weakness..
WIllIAms PercenT rAnge IndIcATor cAlculATIon
R% = – ((H – C)/(H – L)) x 100;
where:
C – latest close price;
L – the lowest price over a given period;
H – the highest price over a given period.
Source: IFC Markets Broker (Review and Forex Rebates Up to 85%)
Categories :
Tags : An Introduction To Ichimoku In Forex Average True Range - ATR Definition Average True Range (ATR) Indicator Bollinger Band Indicator Bollinger Bands Indicator To trading Commodity Channel Index (CCI) Indicator DeMarker Indicator Demarker Indicator Definition DeMarker Indicator Explained How do I use Relative Vigor Index How to Day Trade with the Force Index How to Trade CCI in Forex Market How to Trade with RSI in the Market How to Use Bollinger Bands How to Use Bollinger Bands in Forex How to Use Force Index Indicator How to Use Momentum Indicators How to Use the Average True Range Indicator? How to Use the CCI Indicator How to Use the DeMarker indicator in Forex How to Use the Envelope Indicator in Forex How to Use the Ichimoku Indicator How to Use the MACD Indicator How To Use The Williams % Range Ichimoku Cloud Definition Ichimoku Indicator - An Introduction To Ichimoku In Forex MACD Indicator (Moving Average Convergence Divergence Momentum Indicator Explained Moving-Average Convergence/Divergence (MACD) Indicator Relative Strength Index Stochastic Indicator - Stochastic Oscillator Definition Use The Relative Strength Index Using the Envelopes Indicator for Trading Williams Percent Range (WPR) Indicator Williams Percent Range (WPR) Indicator - Williams Percent Range Explained

