WRB Analysis – This WRB Analysis basic tutorial chapters 1, 2, 3 are extremely detailed to remove as much subjectivity as possible. It’s one of the primary reasons why it’s a tough read for some traders trying to use concepts from the free study guide to better understand the price action they’re trading. Yet, traders that say it’s an easy read…usually are traders that have a basic understanding of supply/demand, a basic understanding of volatility analysis or a basic understanding of how key market events impact the price action they’re trading.
Also, we highly recommend you use this free study guide with our free real-time chat room called TheStrategyLab to ask questions and to get answers about WRB Analysis if you’re having problems understanding the concepts in this free study guide or don’t understand how the concepts will be useful in your trading…real-time WRB Analysis of your questions without the hindsight crap.
Introduction of WRB, WRB Hidden GAP, and S/R Levels
Your first question at the TSL Support Forum will start your 30 days free support (getting answers to your questions). In addition, we expect questions from new traders, traders new to supply/demand analysis, traders new to volatility analysis or traders new to reading technical explanations of price action via objective rules. Further, your responsibility is to take advantage of our free support via asking “specific questions” especially when you’ve read something in this technical study guide that’s unclear or doesn’t make any sense to you.
Also, do not post questions that ask if an interval on your chart is a WRB or WRB Hidden GAP because you will be able to answer such questions via reviewing these concepts in this study guide. This study guide has clear definitions along with chart examples. In contrast, if you don’t understand something I’ve said in this study guide…please quote the statement with your question so that I can reply to you with an answer that’s easier to understand in comparison to what I’ve said in this study guide. In addition, prior to posting questions about if a particular WRB Hidden GAP qualifies as a WRB Zone…quote the “price action definition” from tutorial chapter 2 that you think best fits the WRB Zone price action on your chart. I’ll then reply via a simple Yes or No along with additional trading tips if merited.
With that said, understanding the price action prior to the appearance of any trade signal or profit target is critical to trading profitably and it will explain to you why the market did what it did. Also, it will allow you to adapt your trading plan to the markets whenever the markets change (a change that happens many times each year) so that you can avoid drawdown periods or worst.
Simply, understanding the markets is an edge that can be consistently exploited along with empowering you to know when key swing points or strong continuation price actions are most likely to occur.
Volatility Contraction —> WRB —> WRB Hidden GAP —> WRB Zone
In tutorial chapter 1, you’ll learn that volatility contraction is the requirement that must occur prior to a WRB interval…a WRB interval that represents increasing volatility but may not correlate with increasing volume. Next, you’ll learn that only a WRB interval may qualify as WRB Hidden GAP interval. All WRB Hidden GAP represents volatility spikes and volume spikes. Thus, if you trade something like Forex, you’re not a fan of using volume or you’re looking for a way to improve your volume analysis…it’s highly recommended that you use WRB Analysis regardless if you trade stocks, futures, forex or exchange-traded funds.
What exactly is WRB Analysis
WRB Analysis is a method that involves the combination of analyzing changes in volatility and supply/demand. Simply, WRB helps traders to understand and exploit changes in volatility as a way to identify key price areas where there’s an important change in supply/demand prior to the appearance of any trade signals. WRB Analysis is not based on Japanese Candlestick Analysis.
WRB Analysis can be applied to time-based bar charts or candlestick charts, volume-based charts or tick based charts although the chart examples at this website are via time-based candlestick charts.
Also, WRB Analysis identifies changes in supply/demand that are occurring between buyers and sellers along with providing a map for exploiting the price action from swing point to swing point regardless if you’re a day trader, swing trader or position trader.
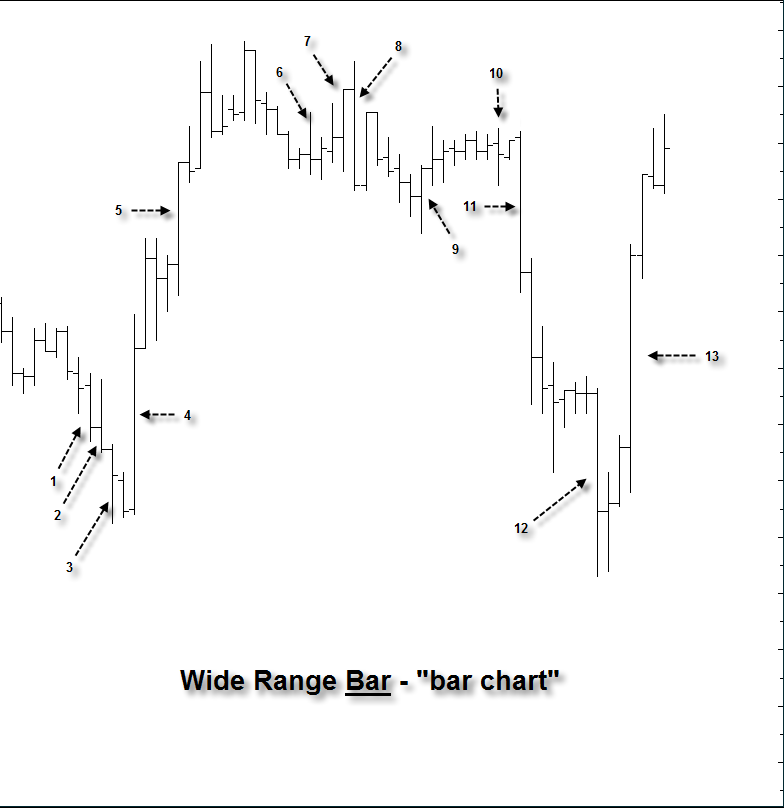
The word WRB means Wide Range Body (candlestick chart users) or Wide Range Bar (bar chart users) and there are different types of WRBs based upon volatility analysis, gap analysis or support/resistance analysis. The wide range is an interval that has a body (the difference between Open and Close) or bar (the difference between high and low) with a price area larger than each of the prior three intervals. In fact, you can use any number greater than three intervals as long as it’s not less than three due to the behavior of volatility analysis because its less reliable and too difficult to analyze the volatility of two intervals or less regardless if the intervals are based upon time, volume or tick. Simply, you want as much market context as possible from the price action to help ensure proper analysis of changes in volatility and supply/demand.
Therefore, don’t mix the definitions of a Wide Range Body with a Wide Range Bar even though both are called WRBs. The Wide Range Bar is a term associated with Bar charts and represents the price area between the High and Low. In contrast, Wide Range Body is a term associated with Candlestick charts and represents the price area between the Close and Open.
Regardless if you’re using bar charts or candlestick charts, WRB Analysis can be applied to any type of chart where you can see WRBs and WRB Hidden Gaps. Yet, there will often be a different number of WRBs, WRB Hidden Gaps, and WRB Zones depending upon what aspect of the expansion interval is being used as a measurement.
Also, even though you may see the word body used more often than the word bar in my discussions of WRB Analysis at TheStrategyLab.com or charts posted elsewhere online, it does not imply that candlestick charts should be used instead of bar charts…it’s only because I have a personal preference for using candlestick charts even though WRB Analysis has nothing to do with Japanese Candlestick Analysis.
Further, most of our clients are using the WRB Analysis in their trading of forex currencies, futures, stocks or exchange-traded funds as position traders, swing traders or day traders via bar charts, candlestick charts or continuous tick charts.
Charts of WRB (wide range bodies) and (wide range bars)
We ask for you to take a closer look at the chart examples below to see the technical difference when comparing a candlestick chart to a bar chart via WRB Analysis on the exact same price action. In fact, any charts with a direct link posted below the chart imply the actual chart is larger than the chart displayed in this document and that you need to use the link to get the actual chart size (download and print the chart) because the chart image is too large for this document.
The below chart is a bar chart showing 13 WRBs based upon the WRB definition that a Wide Range Bar is an interval that has a range (the difference between High and Low) with a price area larger than the range of each of the prior three intervals (each interval individually compared to the WRB).
The below chart is a bar chart showing 14 WRBs based upon the WRB definition that a Wide Range Body is an interval that has a body (a difference between Open and Close) with a price area larger than the bodies of each of the prior three intervals (each interval individually compared to the WRB).
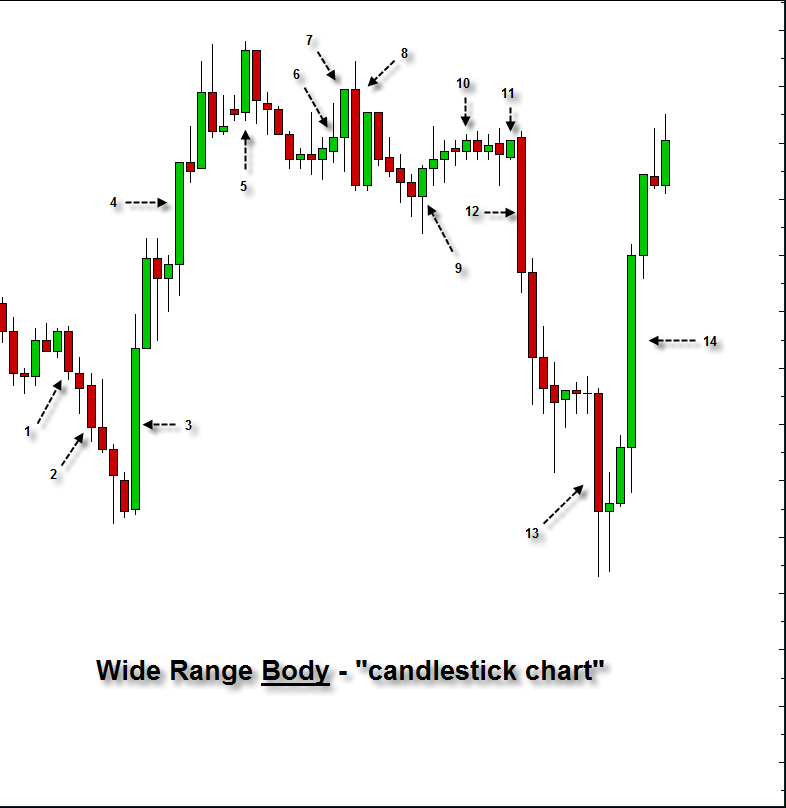
You can now see the subtle technical difference between a bar chart versus a candlestick chart via identifying WRBs…differences such as the number of WRBs and different intervals being identified as WRBs. However, not all WRBs are important. Thus, we only want to monitor the few WRBs that transform into WRB Hidden Gaps as shown in the next few charts
WRB Hidden GAP
The term Hidden GAP is a poor description and may confuse some traders.
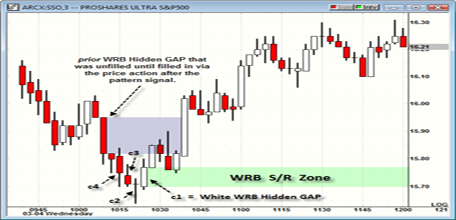
First of all, the phrase Hidden GAP implies the price action within the range of the interval (difference between High and Low) on bar charts or range of the body (difference between Open and Close) on candlestick charts are typically viewed by most traders as only a volatility spike or expansion interval without realizing the price action involves trade actions of key market participants. Thus, there’s a wealth of hidden information in these expansion intervals that identifies important trade positions by key market participants which is the reason why I started using the phrase Hidden GAP. Simply, the WRB Hidden GAP represents key changes in supply/demand involving key market participants that allows us, retail traders, to visualize the key change in supply/demand via WRB Hidden GAPs as swing points, reaction points, trend reversals or strong continuation price actions. Just as important, more often than not, these key price areas have an impact on the price action that occurs afterwards until price action traverses through the area.
The visualization of key market participants via WRB Hidden GAPs allows traders to improve risk management, improved trade management, improved position size management in comparison to participating in trades outside of these key changes in supply/demand price areas.
With that said, a WRB Hidden GAP must first qualify as a WRB prior to being transformed into a WRB Hidden GAP.
The Hidden GAP is determined (defined) by the price action of the single interval before the WRB and the price action of the single interval after the WRB. Simply, as shown in the next several charts, if you remove the WRB and there’s no overlapping in prices (not a single tick) between the interval before the WRB and the interval after the WRB…the WRB is transformed into a WRB Hidden GAP based upon the price action of the interval before the WRB and the interval after the WRB. Therefore, it’s the first interval before and after the WRB that will help determine the size of the Hidden GAP area for those WRBs that qualify as a WRB Hidden GAP.
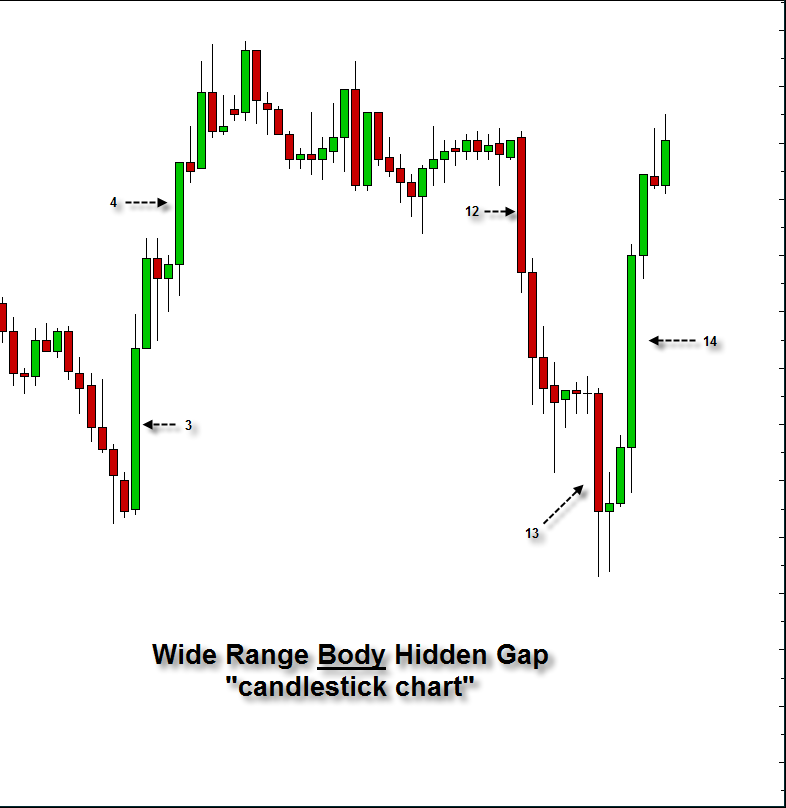
Now study the next chart very carefully. You’ll see that the WRB Hidden GAP intervals have been removed from the below bar chart and candlestick chart to show that the interval before and after the WRB do not have any overlapping price action in ticks. Simply, if the intervals before and after are overlapping any single tick in the price action, there’s no key change in volatility or supply/demand because it would just be a WRB (not a WRB Hidden GAP) that represents indecisive market participants.
To Read More, Please Download The book.
Source: TheStrategyLab.com
Bar Chart, binary options learn, binary options strategy pdf, binary options trader, binary trading strategies pdf, candlestick charts, forex bonus without deposit, Forex Broker, forex broker bonus, Forex Education, forex learn, forex learning, forex learning pdf, forex trading learn, forex tutorials for beginners pdf, how to trade forex for beginners pdf, learn binary, learn forex market, learn forex market trading, learning forex trading online, learning forex trading pdf, trading binary options strategies and tactics pdf free, WRB Analysis, WRB Hidden GAP
Similar Videos and E-books


All Books
For Beginners
- Candlesticks For Support And Resistance
- Online Trading Courses
- Commodity Futures Trading for Beginners
- Hidden Divergence
- Peaks and Troughs
- Reverse Divergences And Momentum
- Strategy:10
- The NYSE Tick Index And Candlesticks
- Trend Determination
- The Original Turtle Trading Rules
- Introduction to Forex
- The Six Forces of Forex
- Study Book for Successful Foreign Exchange Dealing
- Forex. On-Line Manual for Successful Trading
- 18 Trading Champions Share Their Keys to Top Trading Profits
- The Way to Trade Forex
- The Truth About Fibonacci Trading
- Quick Guide to Forex Trading
- Chart Patterns and Technical Indicators
- Forex Trading
- Trading Forex: What Investors Need to Know
- My Dog Ate My Forex
- Point & Figure for Forex
Forex Market in General
- Screen Information, Trader Activity, and Bid-Ask Spreads in a Limit Order Market
- Strategic experimentation in a dealership market
- Limit Orders, Depth, and Volatility
- Reminiscences of a Stock Operator
- Market Profile Basics
- Quote Setting and Price Formation in an Order Driven Market
- Phantom of the Pits
- An Introduction to Market Profile and a Users Guide to Capital Flow Software
- The Effect of Tick Size on Volatility, Trader Behavior, and Market Quality
- Trading as a Business
- What Moves the Currency Market?
- Macroeconomic Implications of the Beliefs and Behavior of Foreign Exchange Traders
- All About the Foreign Exchange Market in the United States
Psychology of Trading
- A Course in Miracles
- Thoughts on Trading
- Calming The Mind So That Body Can Perform
- Lifestyles of the Rich and Pipped
- The Miracle of Discipline
- Zoom in on Personal Trading Behavior And Profit from It
- The Woodchuck and the Possum
- 25 Rules Of Forex Trading Discipline
- Stop Losses Are For Sissies
- Your Personality and Successful Trading
- Trading as a Business
- The 7 Deadly Sins of Forex (and How to Avoid Them)
- The 5 Steps to Becoming a Trader
Money Management
- Risk Control and Money Management
- Money Management
- Position-sizing Effects on Trader Performance: An experimental analysis
- Fine-Tuning Your Money Management System
- Money Management: Controlling Risk and Capturing Profits
- Money Management Strategies for Serious Traders
- The Truth About Money Management
- Money Management and Risk Management
Forex Strategy
- 1-2-3 System
- Bollinger Bandit Trading Strategy
- Value Area
- The Dynamic Breakout II Strategy
- Ghost Trader Trading Strategy
- King Keltner Trading Strategy
- Scalp Trading Methods
- LSS - An Introduction to the 3-Day Cycle Method
- Market Turns And Continuation Moves With The Tick Index
- The Money Manager Trading Strategy
- Picking Tops And Bottoms With The Tick Index
- The Super Combo Day Trading Strategy
- The Eleven Elliott Wave Patterns
- The Thermostat Trading Strategy
- Intraday trading with the TICK
- Traders Trick Entry
- Fibonacci Trader Journal
- Rapid Forex
- Microtrading the 1 Minute Chart
- BunnyGirl Forex Trading Strategy Rules and FAQ
- The Daily Fozzy Method
- Forex Traders Cheat Sheet
- Offset Trading
- How to Trade Both Trend and Range Markets by Single Strategy?
- A Practical Guide to Technical Indicators; Moving Averages
- FX Wizard
- FX Destroyer
- A Practical Guide to Swing Trading
- Practical Fibonacci Methods for Forex Trading
- Using The Heikin-Ashi Technique
- The Day Trade Forex System
- 5/13/62
- Not So Squeezy Trading Manual
- KobasFX Strategy
- Killer Patterns
- 3D Trading
- 4 Hour MACD Forex Strategy
- WRB Analysis Tutorial
Advanced Forex Trading
- A New Interpretation of Information Rate
- CCI Manual
- Nicktrader and Jeff Explaining Reverse and Regular Divers
- NickTrader on No Price CCI Divergence Trading
- Are Supply and Demand Driving Stock Prices?
- The Sharpe Ratio
- The Interaction Between the Frequency of Market Quotes, Spread and Volatility in Forex
- Trend Determination
- Trend vs. No Trend
- A Six-Part Study Guide to Market Profile
- How George Soros Knows What He Knows
- Core Point and Figure Chart Patterns
- Coders Guru Full Course
- Point and Figure Charting: a Computational Methodology and Trading Rule Performance in the S&P 500 Futures Market
- Evolving Chart Pattern Sensitive Neural Network Based Forex Trading Agents
- Heisenberg Uncertainty Principle and Economic Analogues of Basic Physical Quantities
- The String Prediction Models as an Invariants of Time Series in Forex Market
- Using Recurrent Neural Networks to Forecasting of Forex
- The New Elliott Wave Rule - Achieve Definitive Wave Counts

